value can be once again determined by displacement over the two following reference
marks that is after displacement of 20μm. The manufactured angular transducers with the
length-coding reference marks have 36 reference marks on the discs with 900 and 18000
lines, while the scales with 36000 lines have 72 reference marks. Rotations which do not
cross adequately 20º or 10º are adequate to establish another absolute position.
3. Optoelectronic coding transducers
The main element of the coding transducer (fig.2) is the rotating coding mask. Each position
of the coding mask (that is each possible to distinguish by given transducer value of
measured quantity) corresponds to the determined combination of transparent and
nontransparent fields for stream of light. This combination presenting 0 or 1 digits of binary
code is read by photoelectric reading complex which consists of a source of light and photo
elements. For each transducer coding path fall separate light-sensitive element in a way that
on the output of the optoelectronic transducer static code is formed. This depends on the the
actual position of the modulating disc. This code can be used directly as a value of measured
quantity. If necessary the decoder enabling the matching code of the transducer disc to the
code of the reading device can be used. About accuracy conversion decides first of all
digitization error depended on number of bites in the output signal of the transducer. In
fig.2 the code transducer was shown, in practice the transducers of 100..1000 grain
resolution working in binary-decimal code (8..12 -bit) or 128..1024 grain resolution working
in binary code (7..10 -bit). If higher precision is required the transducers with several coding
discs coupled to each other by non-backlash gears are used. In this way in the transducer
with two gears (1:100) received 106 resolutions. The basic advantage of the coding
transducers is the generation of parallel static binary code or binary-decimal code which is
the value of the measured quantity. If there is a need parallel code can be easily converted to
serial code. Conversion can be achieved by subsequent reading of information from
particular coding strips. The drawback of both specified codes is the sensibility to making
gross read errors. It comes from strict assembly tolerances of complex: the glass scale (disc) –
a reading device. Elimination of this drawback can be achieved by special construction
352
Optoelectronic Devices and Properties
means (Heidenhein, 2003) (Holejko, 1981) (i.e. reader in shape of a reversed letter V ) or by
applying instead of binary code different codes in which during the change of measured
value of 1 grain, and the change of a state occur only on one code path (i.e. Grey code).
Absolute measuring devices provide actual information of the position. There are also built
converters which additionally produce incremental signals. (fig.2)
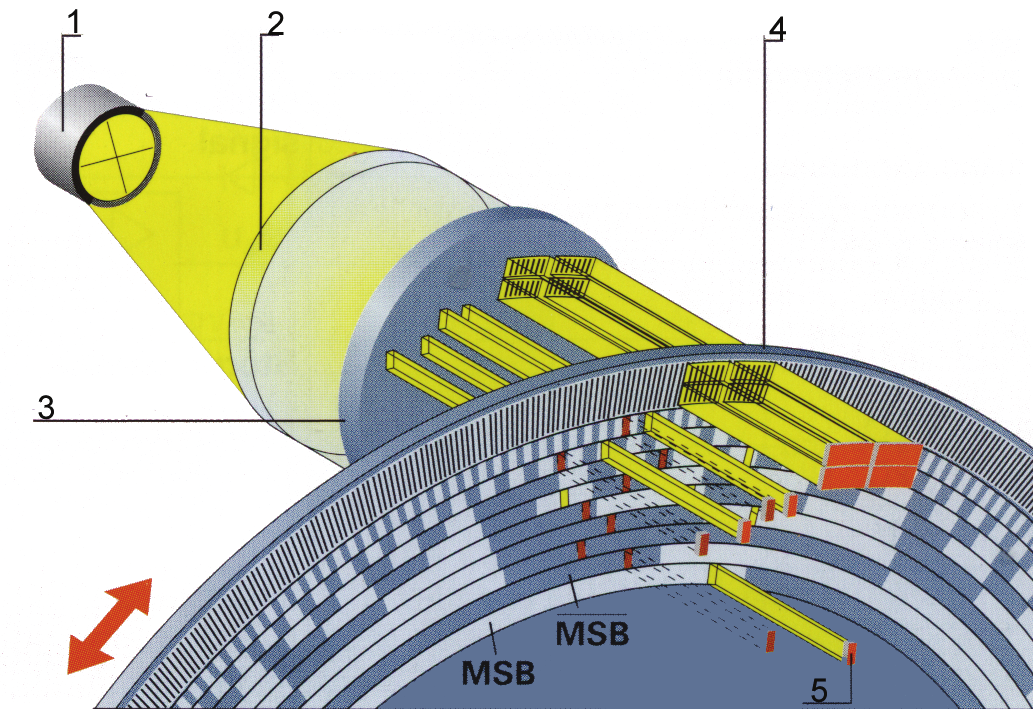
Fig. 2. The construction diagram of the code transducer for measuring angle source of light,
2- condenser lens, 3- scanning reticle, 4- glass scale, 5- solar cells
4. Method of shaping measuring sinusoidal signals of the optoelectronic
transducer
On the glass scale 2, four rectangular fields with scanning reticle 1 are placed. They are
assigned to individual photovoltaic cells. (fig.3)
The parallel light beam produced by the source of light and the lens is incident through the
above mentioned grids on the scale of the scanning reticle and from there on the
photovoltaic cell. The grids have identical widths of light, transparent and opaque fields,
which is a condition for photovoltaic cells to generate sinusoidal voltage signals (Szcześniak,
2005)d (Szcześniak, 2005)g. In order to obtain sufficient signal value, it is advantageous that
the measurement field should consist of N periods T of the displacement division. Then, for
a specified field lit with a radiation beam of intensity Eo, at a given efficiency of the optical
system, we will obtain an effective beam ϕ getting to the photooptic system Ua,Ub,Uc,Ud. We
can form the beam incident on photoelements by placing a scanning reticle with appropriate
relative displacement in relation to the scale index grid 2 of the transducer. The relative
Methods and Devices of Processing Signals of Optoelectronic Position Transducers
353
displacement for the photoelectric system Ua amounts to 0o. The displacement of the
photoelectric system Ub is 1/4 of the period T in relation to the photoelectric system Ua. Its
position is defined by the dependence N2T + 1/4T. On the other hand, the system Uc is
shifted by 1/2 of the period T with respect to the system Ua and of the same period system
Ud is shifted to Ub. The position of this photoelectric system is given by the dependence N1T
+1/2T, N4T + 1/2T. Exemplary positions of the reading fields are presented in the Fig.4. in
which N, N1, N2, N3, N4 denote the number of periods T.
Fig. 3. Method of signal generation in photoelectric position transducer for three
photoelectric systems
We can form the beam incident on photoelements by placing a scanning reticle with
appropriate relative displacement in relation to the scale index grid 2 of the transducer. The
relative displacement for the photoelectric system Ua amounts to 0o. The displacement of
the photoelectric system Ub is 1/4 of the period T in relation to the photoelectric system Ua.
Its position is defined by the dependence N2T + 1/4T. On the other hand, the system Uc is
shifted by 1/2 of the period T with respect to the system Ua and of the same period system
Ud is shifted to Ub. The position of this photoelectric system is given by the dependence N1T
+1/2T, N4T + 1/2T. Exemplary positions of the reading fields are presented in the Fig.4. in
which N, N1, N2, N3, N4 denote the number of periods T.
When the scanning distribution grating is in motion, photovoltaic cells generate sinusoidal
voltage signals :
U = A sinϕ + A , U = A sinϕ + A ,
a
1
o
c
1
o
(1)
U = A cosϕ + A , U = A cosϕ + A ,
b
1
o
d
1
o
354
Optoelectronic Devices and Properties
where: ϕ =2πy/T in addition: A1- signal amplitude, Ao- signal constant component, y -
displacement, T – signal period.
Fig. 4. Diagram of the reading fields of the measurement scale for three photoelectric
systems
Subtracting sinusoidal signals Ua from Uc and Ub from Ud (signals of 180º phase shift), we
get rid of the DC component and receive sinusoidal voltage signal that is symmetrical in
relation to zero and shifted one from another by ¼ of period.
U1=Asinϕ U2=Acosϕ
(2)
The principle of signal processing is presented in Fig.5. The signal period equals the grid
period of the scale T. The method presented in the paper for the compensation of the
signal DC component takes into account its dynamic changes when the transducer
operates under changeable environmental conditions (temperature, humidity, dustiness,
etc.).
Generated signals sin, cos are used to determine the motion direction. They can also be
processed further in order to increase the accuracy of position measurement (Ching-Fen &
Mao-Hong, 2005) (Feel-Soon & Sung-Jun, 2005 ) (Szcześniak & Szcześniak, VIII.2009)
(Szcześniak, 2005)e.
Signals that do not contain a DC component make it possible to generate phase signals and
then multiply the frequency of the signals in comparison to input signals. The generated
signals are rectangular and have pulse–duty factor 0.5. Due to the lack of constant
component in the signal U1, U2 it is possible to directly receive from them rectangular
signals Uw1, Uw2 of pulse–duty factor 0.5. Constant and stable pulse–duty factor ensures
obtaining uniform measurement step α presented in fig.5. The measuring step was defined
as the distance between two subsequent slopes of rectangular signals Uw1, Uw2 (Szcześniak,
2006)b. The number of pulses generated from the slopes of the signals and counted in the
course of measurement gauge shift is the measure of position. Rectangular signals shifted
in relation to each another by ¼ of the period and of pulse–duty factor 0.5 provide the basis
for the determination of the photoelectric transducer motion direction. The method of
shaping measuring signals with compensation of DC constant thus minimizing number of
devices of measuring optoelectronic transducer to three presented in literature (Szcześniak,
2006)b.
Methods and Devices of Processing Signals of Optoelectronic Position Transducers
355
Ua
ϕ
Uc
ϕ
Ub
ϕ
Ud
ϕ
U1
ϕ
U2
ϕ
Uw1
ϕ
Uw2
ϕ
a
Fig. 5. Principle of signal generation in the optoelectronic quantization transducer for
position measurement
5. Methods of processing electric signals of the optoelectronic position
transducers to increase the accuracy of measurement and the motion
direction determining
The development of specialized analog and digital systems allows for processing fast
alternating signals. This means that in practice there are no limits to signal frequency on
356
Optoelectronic Devices and Properties
account of measuring electronic systems. Much more significant are mechanical limits on
account of the dynamic of measured object and its range.
The quantizing transducers (incremental) produce electrical impulse during shift of one unit
of length or angle in a way that on the output of the transducer the number of impulses
proportional to measured value is obtained (Szcześniak & Szcześniak, IV.2009).
About measurement accuracy of the optoelectronic transducers decides first of all value of
discretisation error which is depended on number of modulation elements fall to number of
linear or angular shift unit. The input signal of the optoelectronic transducer in a form of
variable in time linear or angular velocity is integrated in time resulting in constant
increasing of position y(t) presented in fig.6. Uniformly spaced sequences of light
transparent and nontransparent fields create a measuring scale which conducts rhe
operation of quantization horizontally continuous in position time y(t). Next, quantized
signal of increasing position ykw(t) is differentiated in the circuit of optoelectronic
transducer. Each another increase of position y of unit T (quantum) cause receiving impulse
of output signal Uwy of frequency proportional to velocity moving mechanism. An example
of time signal functions is presented in fig.6.
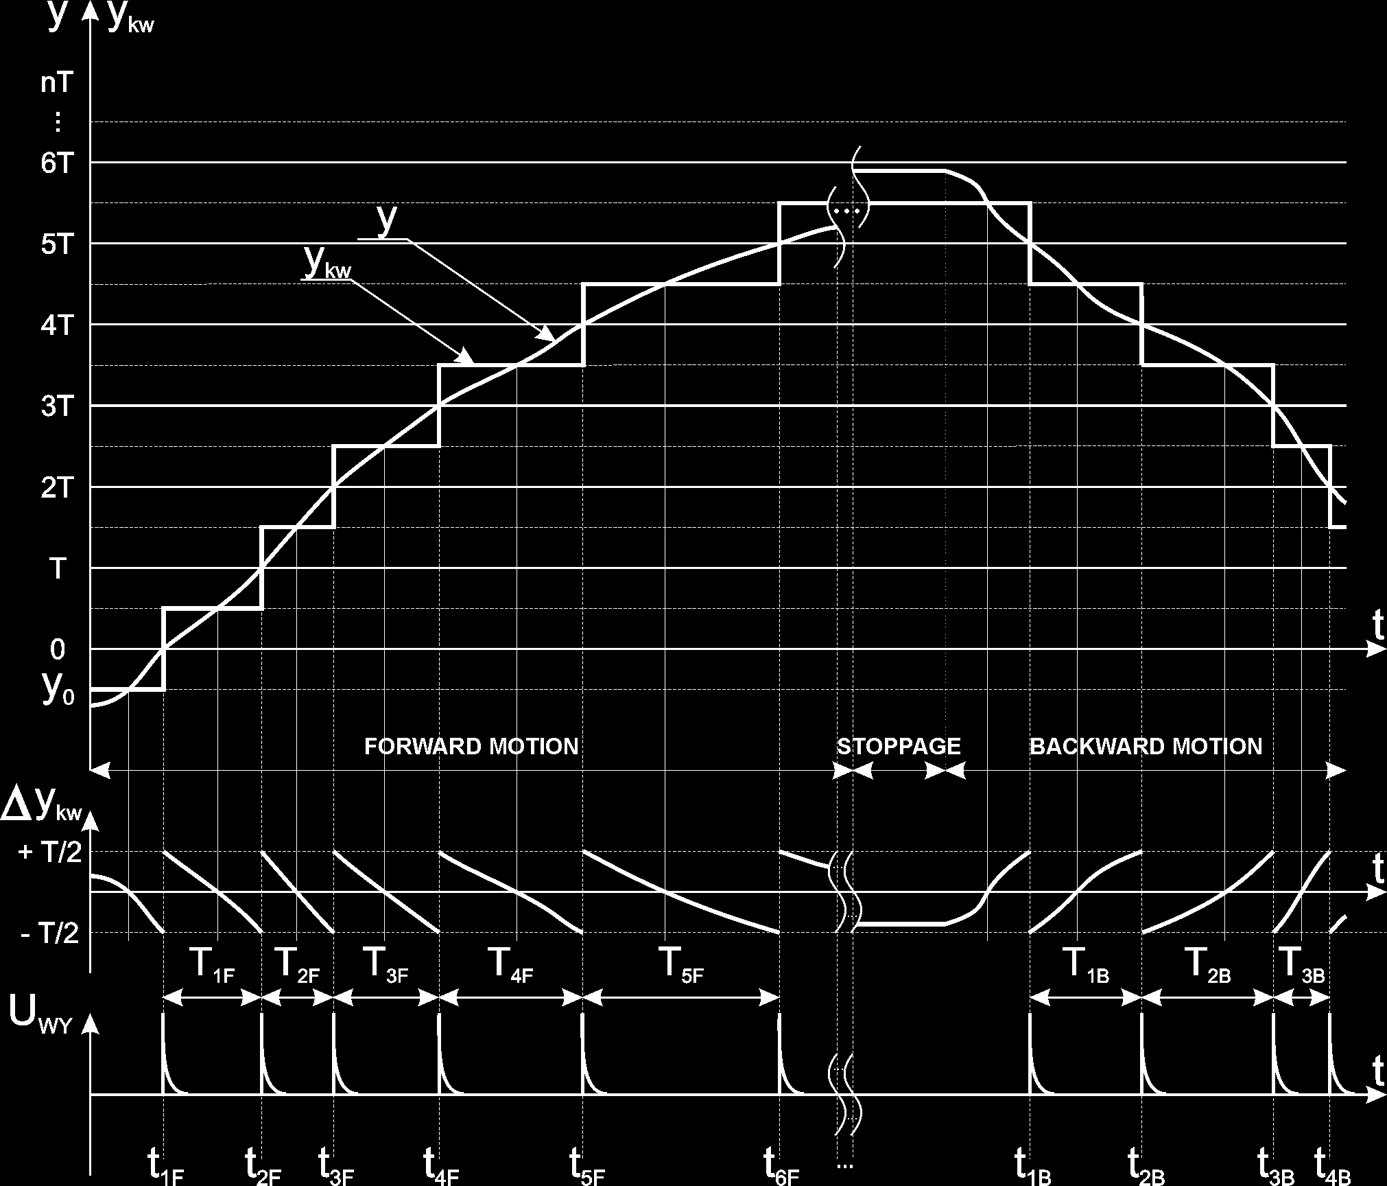
Fig. 6. Time functions of signals in the optoelectronic position transducer
Position increase from initial value y0 with velocity proportional to value of input signal
(velocity moving mechanism) and is quantized horizontally with step equals T. The position
is presented for three phases of motion: forward motion, stoppage and backward motion.
Error of quantization Δ ykw consist in a range of ±T/2. In particular moment of time t1F, t2F, t3F
position y reaches following values T, 2T, 3T... and on the input of the sensor we receive

Methods and Devices of Processing Signals of Optoelectronic Position Transducers
357
impulses spaced one from another in time of T1F, T2F, T3F... creating output signal of motion
frequency in the forward direction. For the backward motion direction, impulses are
generated in moments t1F, t2F, t3F etc. In the presented figure, motion impulse is generated
based on an equal step of quantization T, but in different moments depending on velocity of
motion so the method of distinguishing the motion direction of the optoelectronic
transducer was used. This method produces one impulse per one period of the glass scale.
Below is presented the electronic method of increasing accuracy of the optoelectronic
transducer by applying electronic interpolation (multiplication of signals` frequencies) and
digitalization (conversion to digital form) and electronic methods of distinguishing motion
direction and measurement of position with possibility of additional increase of
optoelectronic transducer accuracy working with an object.
6. Method for the multiplication of the optoelectronic position transducer
measurement signal frequency
Optoelectronic transducer output signals are composed of two sinusoidal signals, phase
shifted with respect to each other by ¼ of the period. The signal period is equal to the
period of the transducer scale grid (measurement bar). The scanning signals from
transducers are first amplified and then interpolated. The interpolation method proposed by
the authors relies on a network of resistors. It generates phase-shifted signals from two
sinusoidal scanning signals by means of their vector summation in accordance with the
description below. Voltage signals from the sensor
x
= Asinϕ ; y
= Acosϕ (3)
where: ϕ =2Πy/T in addition A- signal amplitude; y- displacement; T- signal period.
In method of interpolation from signals x, y signals x1, x2, x3 etc. are created. Their phase is
shifted to x signal by angle α, 2α, 3α etc. Initial signals can be written as:
x
= A si
nϕ
x 1 = x cos α y
+ s
in α = Α sin (ϕ + α)
(4)
x 2 = x cos 2 α + y
sin 2 α = Α sin (ϕ + 2 α )
In the relationship above, the resistances R1,R2 are defined as :
R
R
R =
=
1
and R
(5)
sinα
2
cosα
where: α - angle of the assumed phase shift, R – adopted signal reference resistance
Generated voltage on the resistance divider is equal to:
U A
= (sinϕ R + cosϕ R )
d
1
2 (6)
Taking into account the above dependences and after transformation we receive
U = A sin(ϕ + α
d
1
) (7)
in addition A1- the amplitude of a signal generated with the assumed phase shift α
358
Optoelectronic Devices and Properties
For the sake of the method description clarity, it is assumed that the input signals are of
constant frequencies (periods). This case represents the transducer collaboration with the
object moving at constant velocity.
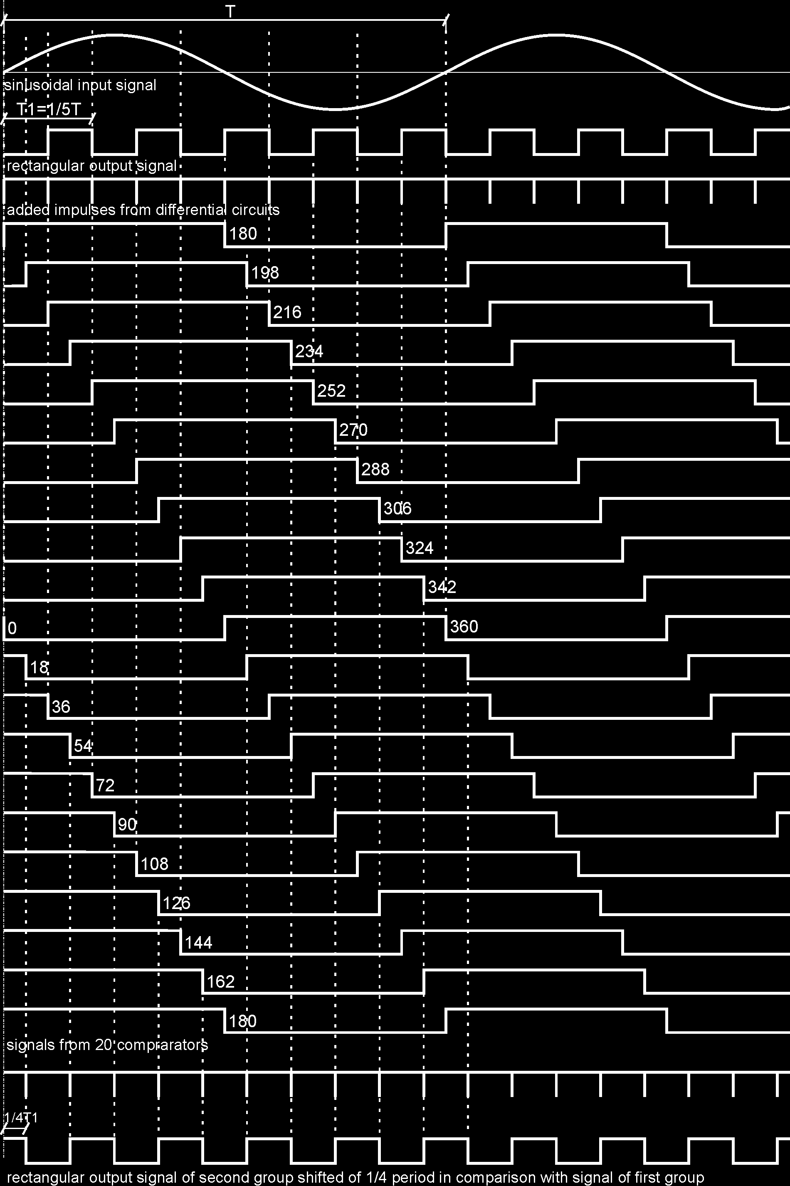
At the first stage of the method, signals are amplified and reversed producing four signals: sin,
cos, -sin, -cos, afterwards two appropriate of them get interpolated. This creates twenty
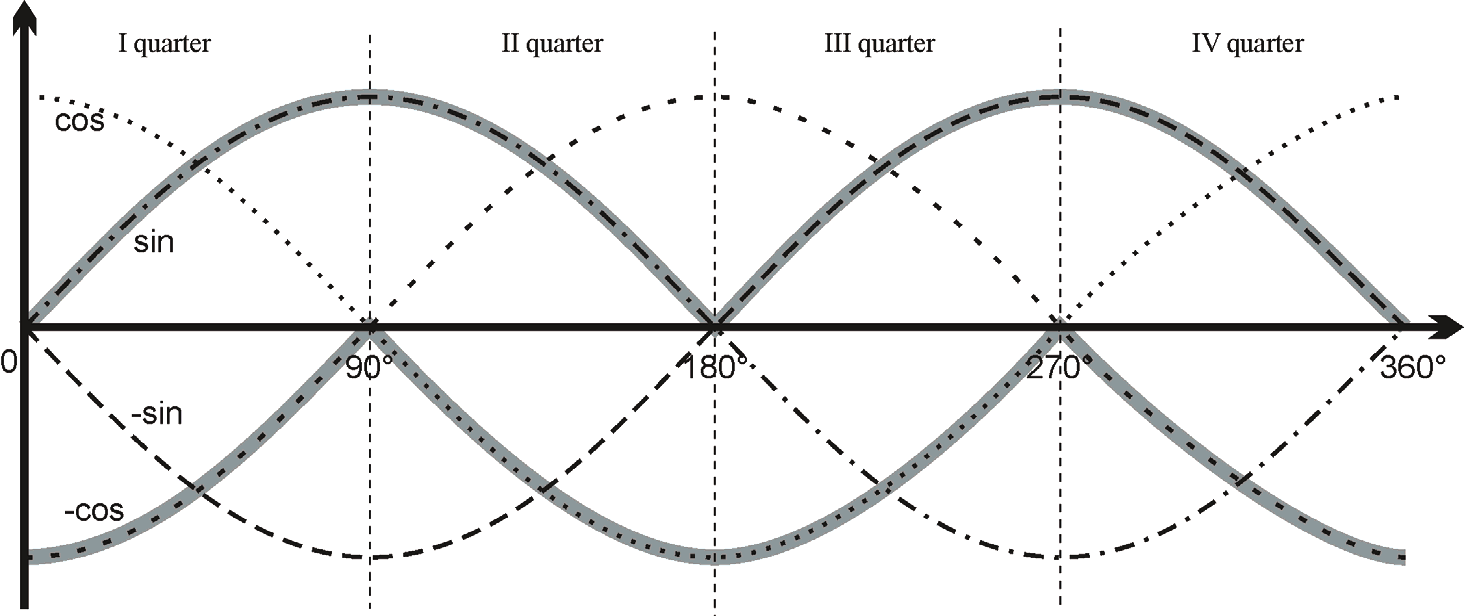
sinusoidal functions shift one from another by 18º. The principle of choosing input signals to
dividers for individual parts of period presents fig.7. It is essential for the signals selected for
interpolation to always have opposite signs in the period quarter that is of interest to us. For
quarter I (0° - 90°) sin and –cos signals are used, for quarter II (90°-180°) they are sin and cos,
for quarter III (180°-270°) the signals are -sin and cos, whereas for quarter IV (270°-360°), they
are -sin and -cos. The signals get to twenty resistance dividers, the values of which are selected
in such a way so that twenty sinusoidal waveforms are generated at their outputs. The
waveforms are shifted with respect to each other by an assumed angle, which in the method
presented amounts to 18°. For so assumed phase shift, for angles 0°, 90º, 180°,270º interpolation
does not occur and the signals -sin, cos, sin, -cos are selected for further processing.
Fig. 7. Selection of signals to interpolation for following parts of period of input signal
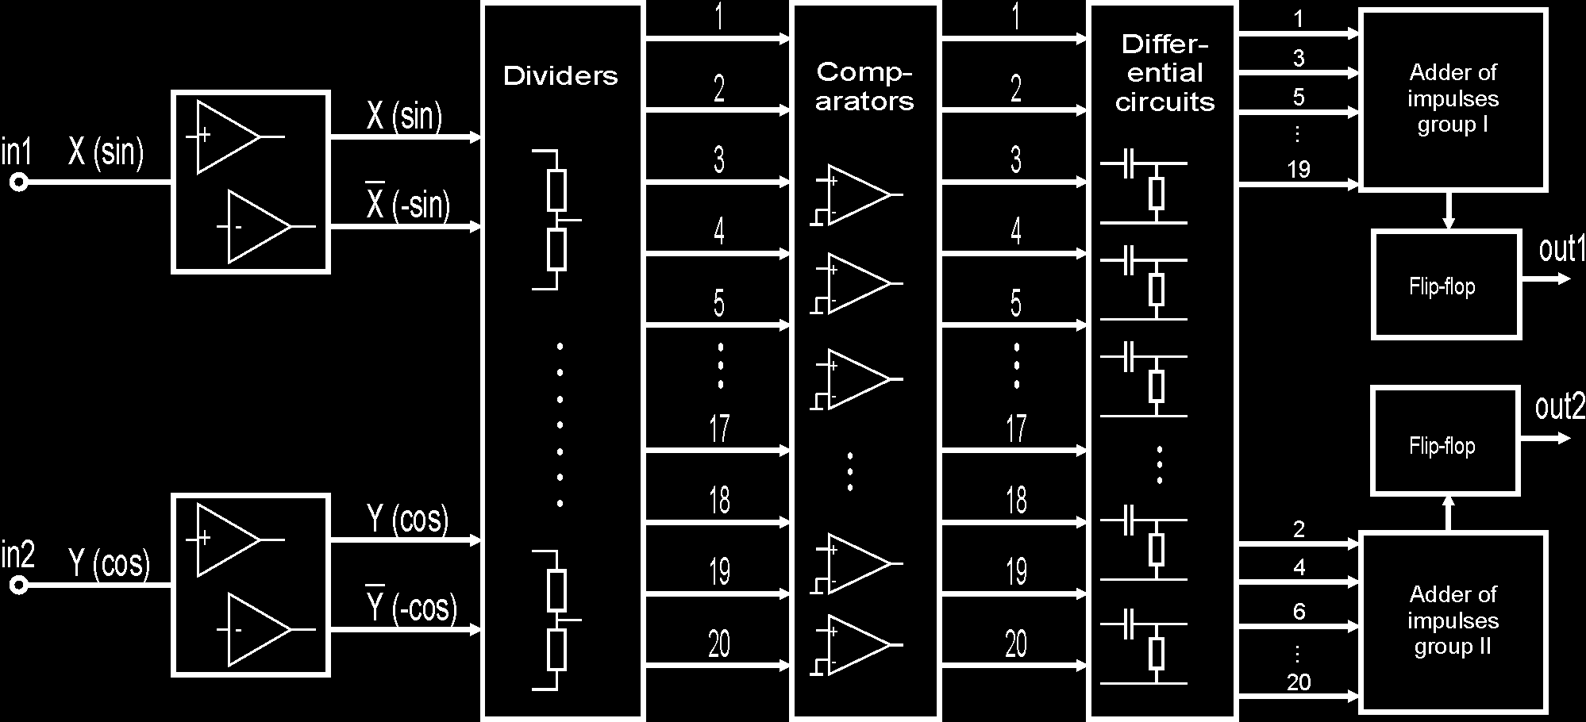
Fig. 8. The block diagram of the system of interpolation and digitalization of transducer signals
Methods and Devices of Processing Signals of Optoelectronic Position Transducers
359
Fig. 9. Time functions of digital part of signals after interpolation
360
Optoelectronic Devices and Properties
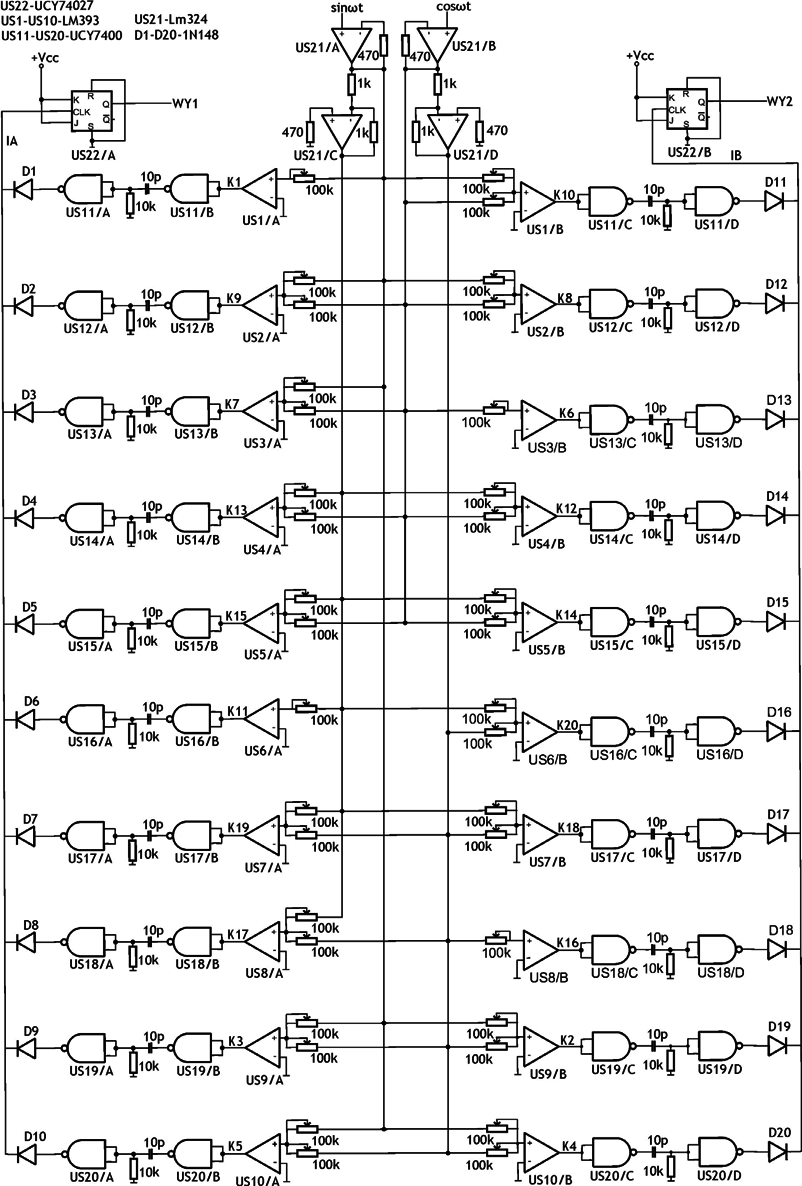
Fig. 10. Schematic diagram of interpolation the circuit and digitalization of transducer
signals
Methods and Devices of Processing Signals of Optoelectronic Position Transducers
361
Angle
α
0 18 36 54 72 90 108 126 144 162
[°]
sinα
0,000 0,309 0,588 0,809 0,951 1,000 0,951 0,809 0,588 0,309
cosα
1,000 0,951 0,809 0,588 0,309 0,000 -0,309 -0,588 -0,809 -0,951
R1 [kΩ]
_ 64,72 34,02 24,72 21,02 20,00 21,02 24,72 34,02 64,72
R2 [kΩ] 20,00 21,02 24,72 34,02 64,72
_ 64,72 34,02 24,72
21,02
Angle
α
180 198 216 234 252 270 288 306 324 342
[°]
sinα
0,000 -0,309 -0,588 -0,809 -0,951 -1,000 -0,951 -0,809 -0,588 -0,309
cosα
-1,000 -0,951 -0,809 -0,588 -0,309 0,000 0,309 0,588 0,809 0,951
R1 [kΩ]
_ 64,72 34,02 24,72 21,02 20,00 21,02 24,72 34,02 64,72
R2 [kΩ] 20,00 21,02 24,72 34,02 64,72
_ 64,72 34,02 24,72
21,02
Table 1. Selection of resistor values for dividers from fig. 10
The generated signals are fed to one of twenty comparators which change their shapes making
them rectangular signals. In addition, the change in state takes place at the site of the input
signal passing zero. In this way twenty rectangular signals shifted with respect to each other
by 1/20 period (18°) are generated. The signals are divided into two groups in such a manner
that in each group each successive signal was shifted by 1/10 period with respect to the
previous one. Two groups of signals are formed, each containing ten signals shifted by 1/10
period within the group and by 1/20 period with respect to the other group (Fig.9, Fig.10).
The next stage consists in such differentiation of waveforms so that each run would yield
only one pulse in the period, i.e. one group will produce ten pulses dividing one period of
input reference signal into ten equal parts, on the assumption that the frequency of input
signals is constant. Pulses from two groups are summed to form two pulse waveforms of the
frequency that is five times higher than the input signal (Fig.8, Fig.10). They operate as clock
signals for JK triggers arranged in such as manner that each pulse of input clock signal
causes the change of state to the opposite one at the trigger output. As a result, two
symmetrical rectangular waveforms are created of the input frequency that is 5 times higher,
i.e. there is one input sinusoidal signal period to 5 periods of output rectangular signal. The
signals are shifted with respect to each other by 1/4 period and the displacement direction
depends on the direction of input signal shift, which is dependent on the transducer motion
direction (Pizoń et al., 1993) (Szcześniak, 2005)c (Szcześniak, 2005)f.
7. Method of optoelectronic transducer motion direction discrimination
based on logical functions of the transducer signals
In the previous chapter, the method of increasing the frequency of the measuring signal in
relation to the frequency resulting from quantization of position by the glass scale was
presented. The output signal is shaped as two rectangular signals shifted one from another
by ¼ period. These signals are used in processing systems which distinguish the motion
direction of a drive coupled with the transducer. Appropriate shaping of these signals
enables additional increase of processing accuracy of the transducer. (Pizoń et al., 1993)
(Szcześniak & Szcześniak, 2009)a (Szcześniak & Szcześniak, 2009)b (Szcześniak, 2006) a. The
method of optoelectronic transducer motion direction discrimination of the optoelectronic
transducer is illustrated by time functions in fig.11. Circuit structure of optoelectronic
362
Optoelectronic Devices and Properties
transducer motion direction discrimination based on logical functions of transducer signals
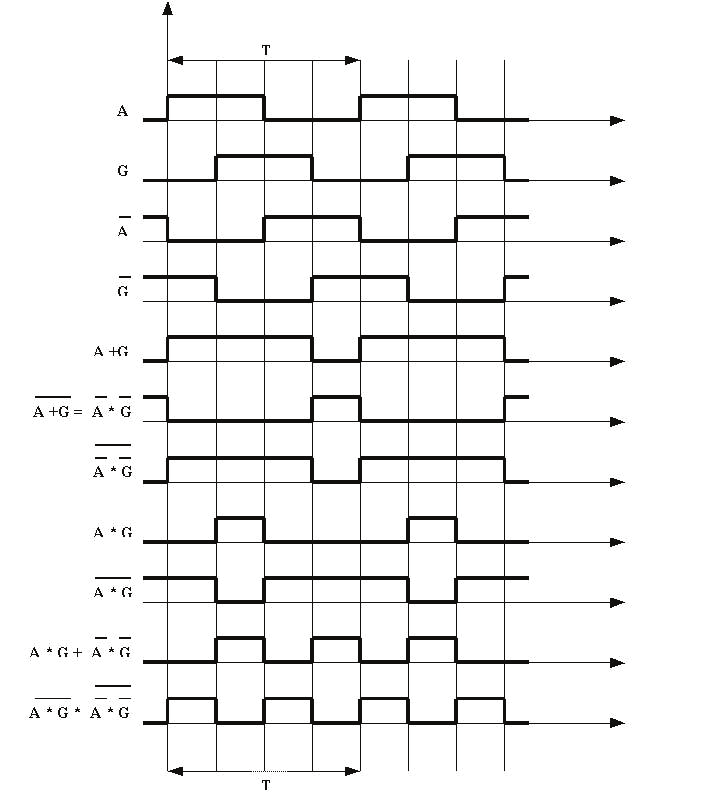
presents fig.12. During the transducer operation the electric rectangular signals A, G, shifted
by quarter period are obtained on their two outputs (Fig.11, Fig.12). The task of the
presented electronic system is counting the adequately generated motion impulses and
distinguishing their sequence. The method is based on motion pulses generation on the base
of the sum of the signals A+G and on the base of their product AG, what is presented in Fig.
1. Making the sum of those pulses
WY = A + G + AG (8)
it is possible to generate, during the period T, 1 or 2 pulses, which are counted in the reverse
order.
Fig. 11. Method of optoelectronic transducer motion direction discrimination based on
logical functions of the transducer signals
Methods and Devices of Processing Signals of Optoelectronic Position Transducers
363
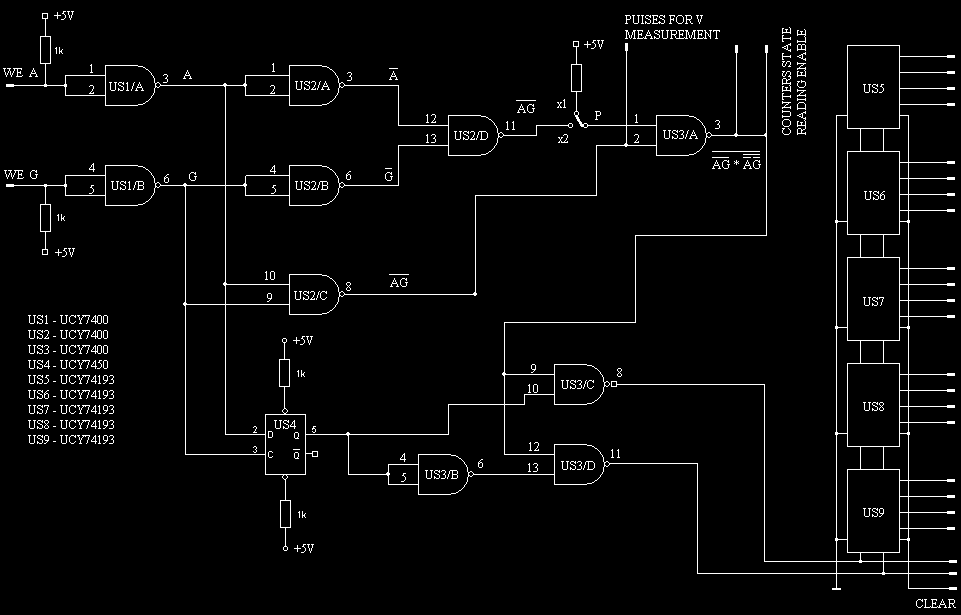
Fig. 12. System of optoelectronic transducer motion direction discrimination based on
logical functions of the transducer signals
The counting order is chosen dependently on the shift between the A and G signals, what is
set by the trigger. The G signal is delivered to the clock input and the A signal is delivered
to the D input of the trigger. Change of the G signal from "0" to "1", when A="1", sets the Q
trigger to "1". Counting to the right is then enabled. In the case when change of the G signal
appears at A="0", i.e. when the G signal is leading to the A signal (change of the motion
direction, the Q trigger changes its state and counting to the left is enabled. The system
enables the choice of measurement accuracy x1 or x2, dependently on the setting of the P
switch.
8. Method of optoelectronic transducer motion direction discrimination
based on logical functions of the transducer signals and motion pulses
generated in the RC circuits
In this method (Fig.13, Fig.14.), by summing