1940
1945
1950
1955
1960
1965
1970
1975
1980
Population
32.1
30.5
24.4
23.0
19.1
15.6
12.4
9.7
8.9
7.2
Table 13.6
The linear regression equation is y-hat = 1166.93 – 0.5868x
Exercise 13.1.31
(Solution on p. 582.)
What was the expected farm population (in millions of persons) for 1980?
A. 7.2
B. 5.1
C. 6.0
D. 8.0
Exercise 13.1.32
(Solution on p. 582.)
In linear regression, which is the best possible SSE?
A. 13.46
B. 18.22
C. 24.05
D. 16.33
Exercise 13.1.33
(Solution on p. 582.)
In regression analysis, if the correlation coefficient is close to 1 what can be said about the best fit
line?
A. It is a horizontal line. Therefore, we can not use it.
B. There is a strong linear pattern. Therefore, it is most likely a good model to be used.
C. The coefficient correlation is close to the limit. Therefore, it is hard to make a decision.
D. We do not have the equation. Therefore, we can not say anything about it.
Question 34-36 refer to the following:
A study of the career plans of young women and men sent questionnaires to all 722 members of the senior
class in the College of Business Administration at the University of Illinois. One question asked which
major within the business program the student had chosen. Here are the data from the students who
responded.
APPENDIX
535
Female
Male
Accounting
68
56
Administration
91
40
Ecomonics
5
6
Finance
61
59
Table 13.7: Does the data suggest that there is a relationship between the gender of students and their
choice of major?
Exercise 13.1.34
(Solution on p. 582.)
The distribution for the test is:
A. Chi28
B. Chi23
C. t722
D. N (0, 1)
Exercise 13.1.35
(Solution on p. 582.)
The expected number of female who choose Finance is :
A. 37
B. 61
C. 60
D. 70
Exercise 13.1.36
(Solution on p. 582.)
The p-value is 0.0127. The conclusion to the test is:
A. The choice of major and the gender of the student are independent of each other.
B. The choice of major and the gender of the student are not independent of each other.
C. Students find Economics very hard.
D. More females prefer Administration than males.
Exercise 13.1.37
(Solution on p. 582.)
An agency reported that the work force nationwide is composed of 10% professional, 10% clerical,
30% skilled, 15% service, and 35% semiskilled laborers. A random sample of 100 San Jose residents
indicated 15 professional, 15 clerical, 40 skilled, 10 service, and 20 semiskilled laborers. At α = .10
does the work force in San Jose appear to be consistent with the agency report for the nation?
Which kind of test is it?
A. Chi2 goodness of fit
B. Chi2 test of independence
C. Independent groups proportions
D. Unable to determine
536
APPENDIX
13.2 Practice Final Exam 22
Exercise 13.2.1
(Solution on p. 582.)
A study was done to determine the proportion of teenagers that own a car. The true proportion
of teenagers that own a car is the:
A. statistic
B. parameter
C. population
D. variable
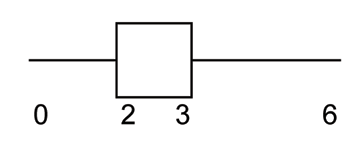
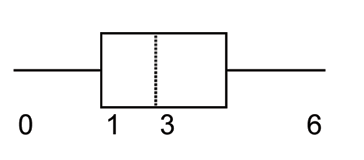
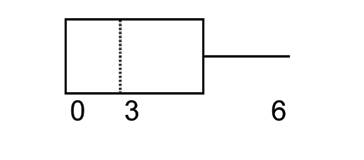
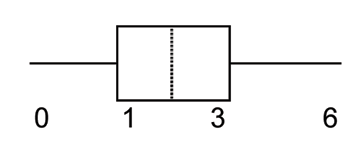
The next two questions refer to the following data:
value
frequency
0
1
1
4
2
7
3
9
6
4
Table 13.8
Exercise 13.2.2
(Solution on p. 582.)
The box plot for the data is:
A.
B.
C.
2This content is available online at <http://cnx.org/content/m16303/1.15/>.
APPENDIX
537
D.
Exercise 13.2.3
(Solution on p. 582.)
If 6 were added to each value of the data in the table, the 15th percentile of the new list of values
is:
A. 6
B. 1
C. 7
D. 8
The next two questions refer to the following situation:
Suppose that the probability of a drought in any independent year is 20%. Out of those years in which a
drought occurs, the probability of water rationing is 10%. However, in any year, the probability of water
rationing is 5%.
Exercise 13.2.4
(Solution on p. 582.)
What is the probability of both a drought and water rationing occurring?
A. 0.05
B. 0.01
C. 0.02
D. 0.30
Exercise 13.2.5
(Solution on p. 582.)
Which of the following is true?
A. drought and water rationing are independent events
B. drought and water rationing are mutually exclusive events
C. none of the above
The next two questions refer to the following situation:
Suppose that a survey yielded the following data:
Favorite Pie Type
gender
apple
pumpkin
pecan
female
40
10
30
male
20
30
10
Table 13.9
Exercise 13.2.6
(Solution on p. 582.)
Suppose that one individual is randomly chosen. The probability that the person’s favorite pie is
apple or the person is male is:
538
APPENDIX
A. 40
60
B. 60
140
C. 120
140
D. 100
140
Exercise 13.2.7
(Solution on p. 582.)
Suppose Ho is: Favorite pie type and gender are independent.
The p-value is:
A. ≈ 0
B. 1
C. 0.05
D. cannot be determined
The next two questions refer to the following situation:
Let’s say that the probability that an adult watches the news at least once per week is 0.60. We randomly
survey 14 people. Of interest is the number that watch the news at least once per week.
Exercise 13.2.8
(Solution on p. 582.)
Which of the following statements is FALSE?
A. X ∼ B (14, 0.60)
B. The values for x are: {1, 2, 3, ..., 14}
C. µ = 8.4
D. P (X = 5) = 0.0408
Exercise 13.2.9
(Solution on p. 582.)
Find the probability that at least 6 adults watch the news.
A. 6
14
B. 0.8499
C. 0.9417
D. 0.6429
Exercise 13.2.10
(Solution on p. 582.)
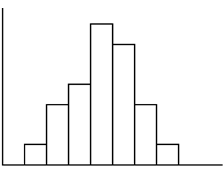
The following histogram is most likely to be a result of sampling from which distribution?
APPENDIX
539
A. Chi-Square
B. Exponential
C. Uniform
D. Binomial
The ages of campus day and evening students is known to be normally distributed. A sample of 6 campus
day and evening students reported their ages (in years) as: {18, 35, 27, 45, 20, 20}
Exercise 13.2.11
(Solution on p. 582.)
What is the error bound for the 90% confidence interval of the true average age?
A. 11.2
B. 22.3
C. 17.5
D. 8.7
Exercise 13.2.12
(Solution on p. 583.)
If a normally distributed random variable has µ = 0 and σ = 1 , then 97.5% of the population
values lie above:
A. -1.96
B. 1.96
C. 1
D. -1
The next three questions refer to the following situation:
The amount of money a customer spends in one trip to the supermarket is known to have an exponential
distribution. Suppose the average amount of money a customer spends in one trip to the supermarket is
$72.
Exercise 13.2.13
(Solution on p. 583.)
What is the probability that one customer spends less than $72 in one trip to the supermarket?
A. 0.6321
540
APPENDIX
B. 0.5000
C. 0.3714
D. 1
Exercise 13.2.14
(Solution on p. 583.)
How much money altogether would you expect next 5 customers to spend in one trip to the
supermarket (in dollars)?
A. 72
B. 722
5
C. 5184
D. 360
Exercise 13.2.15
(Solution on p. 583.)
If you want to find the probability that the average of 5 customers is less than $60, the distribution
to use is:
A. N (72, 72)
B. N 72, 72
√5
C. Exp (72)
D. Exp
1
72
The next three questions refer to the following situation:
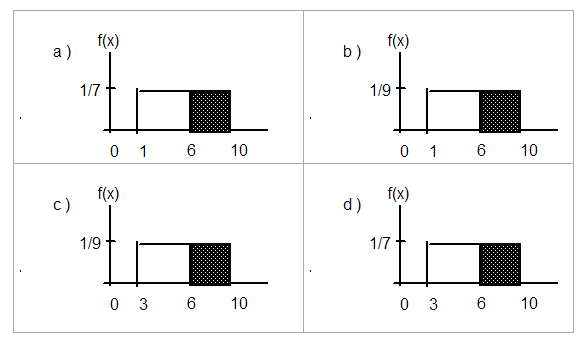
The amount of time it takes a fourth grader to carry out the trash is uniformly distributed in the interval
from 1 to 10 minutes.
Exercise 13.2.16
(Solution on p. 583.)
What is the probability that a randomly chosen fourth grader takes more than 7 minutes to take
out the trash?
A. 39
B. 79
C. 3
10
D. 7
10
Exercise 13.2.17
(Solution on p. 583.)
Which graph best shows the probability that a randomly chosen fourth grader takes more than 6
minutes to take out the trash given that he/she has already taken more than 3 minutes?
APPENDIX
541
Exercise 13.2.18
(Solution on p. 583.)
We should expect a fourth grader to take how many minutes to take out the trash?
A. 4.5
B. 5.5
C. 5
D. 10
The next three questions refer to the following situation:
At the beginning of the quarter, the amount of time a student waits in line at the campus cafeteria is nor-
mally distributed with a mean of 5 minutes and a standard deviation of 1.5 minutes.
Exercise 13.2.19
(Solution on p. 583.)
What is the 90th percentile of waiting times (in minutes)?
A. 1.28
B. 90
C. 7.47
D. 6.92
Exercise 13.2.20
(Solution on p. 583.)
The median waiting time (in minutes) for one student is:
A. 5
B. 50
C. 2.5
D. 1.5
Exercise 13.2.21
(Solution on p. 583.)
Find the probability that the average wait time of 10 students is at most 5.5 minutes.
A. 0.6301
B. 0.8541
C. 0.3694
542
APPENDIX
D. 0.1459
Exercise 13.2.22
(Solution on p. 583.)
A sample of 80 software engineers in Silicon Valley is taken and it is found that 20% of them earn
approximately $50,000 per year. A point estimate for the true proportion of engineers in Silicon
Valley who earn $50,000 per year is:
A. 16
B. 0.2
C. 1
D. 0.95
Exercise 13.2.23
(Solution on p. 583.)
If P (Z < z ) = 0. 1587 where Z∼N (0, 1) , then
α
α is equal to:
A. -1
B. 0.1587
C. 0.8413
D. 1
Exercise 13.2.24
(Solution on p. 583.)
A professor tested 35 students to determine their entering skills. At the end of the term, after
completing the course, the same test was administered to the same 35 students to study their
improvement. This would be a test of:
A. independent groups
B. 2 proportions
C. dependent groups
D. exclusive groups
Exercise 13.2.25
(Solution on p. 583.)
A math exam was given to all the third grade children attending ABC School. Two random
samples of scores were taken.
n
x
s
Boys
55
82
5
Girls
60
86
7
Table 13.10
Which of the following correctly describes the results of a hypothesis test of the claim, “There is
a difference between the mean scores obtained by third grade girls and boys at the 5 % level of
significance”?
A. Do not reject Ho. There is no difference in the mean scores.
B. Do not reject Ho. There is a difference in the mean scores.
C. Reject Ho. There is no difference in the mean scores.
D. Reject Ho. There is a difference in the mean scores.
Exercise 13.2.26
(Solution on p. 583.)
In a survey of 80 males, 45 had played an organized sport growing up. Of the 70 females surveyed,
25 had played an organized sport growing up. We are interested in whether the proportion for
males is higher than the proportion for females. The correct conclusion is:
APPENDIX
543
A. The proportion for males is the same as the proportion for females.
B. The proportion for males is not the same as the proportion for females.
C. The proportion for males is higher than the proportion for females.
D. Not enough information to determine.
Exercise 13.2.27
(Solution on p. 583.)
Note: Chi-Square Test of a Single Variance; Not all classes cover this topic. From past experience,
a statistics teacher has found that the average score on a midterm is 81 with a standard deviation
of 5.2. This term, a class of 49 students had a standard deviation of 5 on the midterm. Do the data
indicate that we should reject the teacher’s claim that the standard deviation is 5.2? Use α = 0.05.
A. Yes
B. No
C. Not enough information given to solve the problem
Exercise 13.2.28
(Solution on p. 583.)
Note: F Distribution Test of ANOVA; Not all classes cover this topic. Three loading machines
are being compared. Ten samples were taken for each machine. Machine I took an average of 31
minutes to load packages with a standard deviation of 2 minutes. Machine II took an average of 28
minutes to load packages with a standard deviation of 1.5 minutes. Machine III took an average of
29 minutes to load packages with a standard deviation of 1 minute. Find the p-value when testing
that the average loading times are the same.
A. the p–value is close to 0
B. p–value is close to 1
C. Not enough information given to solve the problem
The next three questions refer to the following situation:
A corporation has offices in different parts of the country. It has gathered the following information con-
cerning the number of bathrooms and the number of employees at seven sites:
Number of employees x
650
730
810
900
102
107
1150
Number of bathrooms y
40
50
54
61
82
110
121
Table 13.11
Exercise 13.2.29
(Solution on p. 583.)
Is the correlation between the number of employees and the number of bathrooms significant?
A. Yes
B. No
C. Not enough information to answer question
Exercise 13.2.30
(Solution on p. 583.)
The linear regression equation is:
A. ˆ
y = 0.0094 − 79.96x
B. ˆ
y = 79.96 + 0.0094x
C. ˆ
y = 79.96 − 0.0094x
D. ˆ
y = −0.0094 + 79.96x
544
APPENDIX
Exercise 13.2.31
(Solution on p. 583.)
If a site has 1150 employees, approximately how many bathrooms should it have?
A. 69
B. 91
C. 91,954
D. We should not be estimating here.
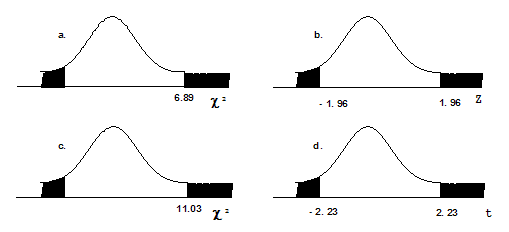
Exercise 13.2.32
(Solution on p. 583.)
Note: Chi-Square Test of a Single Variance; Not all classes cover this topic. Suppose that a sample
of size 10 was collected, with x = 4.4 and s = 1.4 .
H
2
2
o : σ = 1.6 vs. Ha : σ = 1.6. Which graph best describes the results of the test?
Exercise 13.2.33
(Solution on p. 583.)
64 backpackers were asked the number of days their latest backpacking trip was. The number of
days is given in the table below:
# of days
1
2
3
4
5
6
7
8
Frequency
5
9
6
12
7
10
5
10
Table 13.12
Conduct an appropriate test to determine if the distribution is uniform.
A. The p–value is > 0.10 , the distribution is uniform.
B. The p–value is < 0.01 , the distribution is uniform.
C. The p–value is between 0.01 and 0.10, but without α there is not enough information
D. There is no such test that can be conducted.
Exercise 13.2.34
(Solution on p. 583.)
Note: F Distribution test of ANOVA; Not all classes cover this topic. Which of the following
statements is true when using one-way ANOVA?
A. The populations from which the samples are selected have different distributions.