air velocity, m/s
h1
inlet port height, m
T
air temperature, oC
h2
outlet port height, m
Tin
air inlet temperature, oC
k
turbulent kinetic energy, m2/s2
t
time, s
L
length of RACM pipe, m
x, y
Cartesian coordinates
L
distance between inlet port and
1
angle of inlet port, o
floor surface, m
1
L
2
distance between outlet port and
angle of outlet port, o
floor surface, m
2
Pout
outlet vacuum pressure, Pa
turbulent dissipation, m2/s3
PMV
predicted mean vote
temperature gradient, K/m
predicted percentage
PPD
Subscripts
dissatisfied, %
in
Q
cooling air supply flow rate,
oz
occupied zone
m3/h
This paper presents ten cases divided into two groups in order to study the effect of two
parameters on the creation of the airflow circulation cell by using the CFD simulation: the
cool air supply flow rate ( Qin) and outlet port position ( L2). Experimental platforms were set up to test the validity of a simulation model, and the tested results showed good agreement
with simulation. Our simulation results showed that the airflow circulation cell was quite
sensitive to changes in Qin and L2. In comparison with the conventional air-conditioning, the RACM could create a desirable thermal comfort zone and reduce energy consumption by as
much as 91.6 %. In addition, the experimental study shows that the airflow circulation cell
could be managed easily within the occupied zone no matter with or without the manikin
object. These results could be helpful for designers and consultants with needed knowledge
for design of RACM systems.
2. System analysis
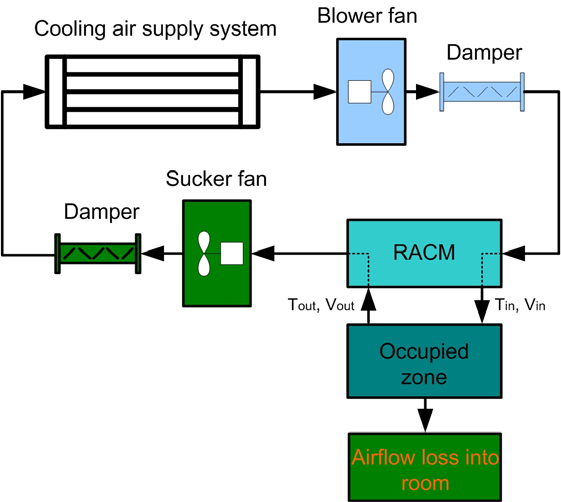
RACM system is a personalized air conditioning system, which is integrated by main
cooling air supply system (CASS), a blower fan, a regional air conditioning system, a sucker fan and two dampers, as shown in Fig. 1. The CASS supplies cooling air to the RACM by the
blower fan. During operating process, the cooling air will channel through the damper,
regulate the cooling air and activate the occupied zone to generate a comfortable zone
according to the opening angle of damper. The cooling air will direct to the RACM, where
the cooling air will exchange the heat with occupied zone in the room, after that the
cooling air was sucked back to the main air conditioning by the sucker fan through the
280
Applied Computational Fluid Dynamics
outlet port with the aim of recycling the cooling air from the occupied zone. Therefore, the RACM can turn on an independent airflow circulation cell. It cannot only satisfy thermal
comfort occupants’ required, but also reduce much energy consumption for the cooling
air supply system.
Fig. 1. Flow diagram of airflow in RACM system
3. Numerical method
3.1 Definition of model geometry and grid generation
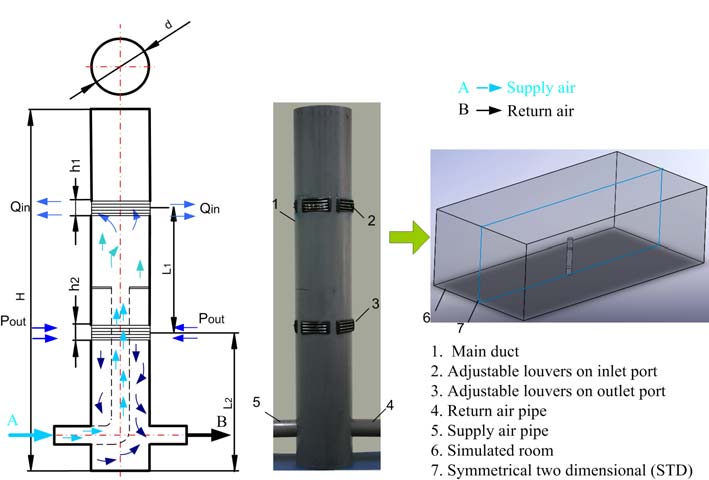
An upper round part of the RACM has been designed for the air inlet and a lower round
part has been designed for the air outlet on the main pipe of the RACM module as shown
in Fig. 2. To improve the airflow distribution feature for space for human occupancy the
adjustable louvers were fastened on inlet and outlet ports. The RACM enable the
occupants to satisfy with respect to their own thermal comfort demands. The CFD code
used in this study is FLUENT 6.3 [18]. The RACM was placed in the centre of the an
empty workroom with no fixed furniture, nor occupants. Therefore, instead of using a 3D
simulated model, a 2D one was applied in this study, as shown in Fig. 3. The 2D model
workroom is the symmetrical two-dimensional (STD) model was described in detail in
Huang’s studies [15–17]. By using the solution-adaptive refinement such as gradient
adaption of velocity, the initial STD model mesh can be refined by adding cells in
occupied zone to enable the physical feature of the independent velocity field to be better
resolved and coarsen in the rest of model room using GAMBIT software [19]. Therefore,
the mesh quality of gradient adaption seems to better than initial mesh around occupied
Study of an Individual Air-Conditioning Energy-Saving Equipment
281
zone of model. About 11555 nodes of triangular mesh are used in the STD model, thus,
the gradient adaption has been chosen for further simulation.
Fig. 2. Model of the regional air conditioning mechanism in the simulated room
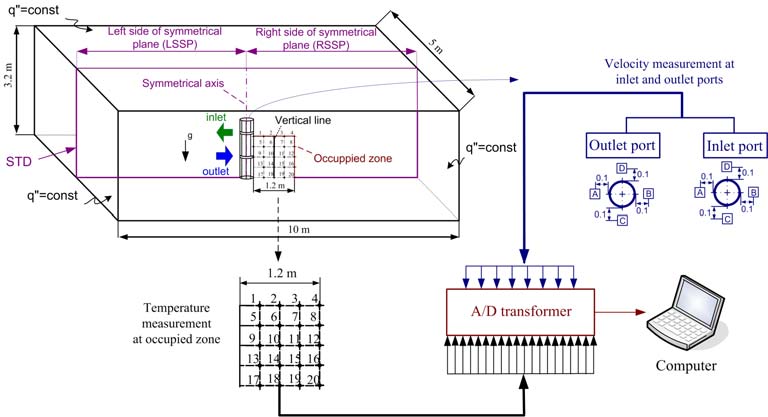
Fig. 3. Sketch layout of the RACM in the room
282
Applied Computational Fluid Dynamics
3.2 Simulation method
Assumptions are made with respect to the simulation of this study as follows:
The major assumptions of our analysis are as follows:
a. Newtonian fluid,
b. unsteady state,
c. effect of gravity and buoyancy are considered,
d. uniform air velocity at the inlet port,
e. standard k model is employed for modeling turbulent flow.
The following are the governing equations:
Continuity equation:
The mass conservation equation, or continuity equation, can be written as follows:
p
( u )
i
m
S (1)
t
x
i
Momentum equation:
v p f (2)
t
Energy equation:
2
2
( e
) .
( e
) .
( p ) q ( f . )
(3)
t
2
2
Where, t is the time, is the mass density, is the flow velocity, p is the fluid pressure. The source Sm is the mass added to the continuous phase from the dispersed second phase and any user-defined sources, q is the heat transfer rate per unit area, e is the internal energy, and f is the body force.
The turbulence equation, which was proposed by Launder and Spalding (1974) to model the
turbulent kinematics viscosity, is primarily related to the eddy viscosity [20].
3.3 Boundary conditions
The airflow equations were solved under the conditions for air inlet/outlet ports, and wall
boundaries. The air supply flow rate ( Qin) and distance between floor surface and outlet port ( L2) were chosen for all ten cases, as shown in Table 1. The outlet vacuum pressure and the Names
Qinlet (m3/h)
L2 (m)
Group 1
Changed from 20 to 110
0.5
Group 2
45
Changed from 0.1 to 0.9
Table 1. Calculation conditions
Study of an Individual Air-Conditioning Energy-Saving Equipment
283
inlet air temperature for overall simulation were 2 Pa and 20 C, respectively. Heat flux of vertical, ceiling, and a floor wall was 50 W m-2. An adiabatic wall condition was chosen for the RACM walls and symmetrical axis. The surfaces of the walls of the room were assumed
to have an emissivity of 0.85. The distance between inlet port and outlet port ( L1) was 0.6
m. RACM diameter ( d) was 0.2 m. The inlet height port ( h1) was from 0.06 m to 0.1 m, outlet port height ( h2) was 0.06 m.
3.4 Validation of CFD simulations
The experiments were carried out in the Department of Mechanical and Electrical
Engineering, National Taipei University of Technology. The schematic layout of the
equipment and system used in this study is shown in Fig. 3. This system consists of a
working room with the internal dimensions of 10 m 5 m 3.2 m (ceiling height), a cooling air supply system, and an innovated RACM. The empty working room had an experimental
temperature of 30 C and a relative humidity of 50%. The study was conducted in Taipei,
Taiwan during the summer, which is usually quite hot and humid. Detailed information
about the equipment used in this study is shown in Table 2. Type-T thermocouple
temperature sensors were set up at 20 points in the occupied zone to compare the
experimental and simulation results, as shown in Fig. 3. A flow meter sensor was used for
velocity measurement at four positions for both the inlet and outlet ports. Signals from
temperature sensors and flow meter sensors were automatically transmitted to an A/D
transformer and Testo−400 with recordings at 1 s intervals to ensure continuous reading by
InstruNet and Comsoft-3 software running on a PC. All measurements were repeated at
least three times at each test setting and the average experimental values of the three tests were considered to ensure stability and consistency.
Working room
10 m 5 m 3.2 m
Cooling air supply system
2.7 kW220 V
Diameter of RACM pipe
0.2 m
Total length of RACM pipe
1.7 m
Height of inlet and outlet ports
(0.060.1) m and 0.06 m
A/D transformer
InstruNet Model 100
Temperature sensor
(-40)(+125) C
Flow meter sensor
060 m/s
Computer Joybook
A52E
Table 2. Main component for the test RACM in the experimental setup.
284
Applied Computational Fluid Dynamics
3.4.1 Temperature at the occupied zone
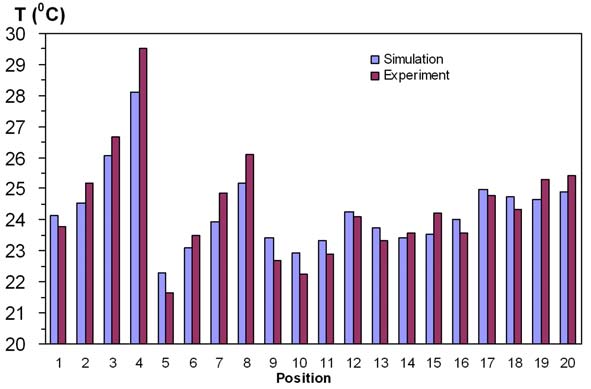
The sensors at 20 points in the occupied zone were set up to compare in-room experimental
and simulation results in the case of Qin = 45 m3/h and L2 = 0.5 m, as shown in Fig. 4. The simulation column shows trends similar to the experimental data column. The temperature
difference between the simulation and experimental results was 0.18−1.38 C in the
occupied zone. It can be seen that the highest difference between the experimental and
simulation results for temperature at the 20 points in the case of Qin = 45 m3/h and L2 = 0.5 m is about 4.7 %. Considering that the airflow is almost uncontrollable and natural, the
simulation results of temperature in the occupied zone are in good agreement with the
experimental data. Deviation at position 4 is larger than that of the other positions in the occupied zone presumably because the position is for the cooling air supply. On the other
hand, part of the deviation may also be due to results from unsteady operation of the
experiment.
Fig. 4. Comparison of temperature between the experimental and simulation in the occupied
zone of the room.
3.4.2 Velocity at inlet and outlet ports
Table 3 shows the comparisons of the experimental and simulation results of velocity for
eight positions at the inlet and outlet ports under Qin = 45 m3/h and L2 = 0.5 m. The simulation and experimental results under the positions were good; however, it seems that
the largest deviation is still large (~9.4 %).
In short, experimental and CFD data include the temperature and velocity in the occupied
zone. The results of simulation are slightly different from the results of the experiments,
around 9.4%. The fairly good agreement between experimental and simulation results
indicates that the CFD simulation is possible to use in the investigation of in-room
characteristics of the RACM.
Study of an Individual Air-Conditioning Energy-Saving Equipment
285
Position Experiment
(m3/h) Simulation
(m3/h)
Air supply flow rate
44 45
Front inlet port
Position A
0.212
0.234
Position B
0.25
0.248
Position C
0.231
0.245
Position D
0.213
0.225
Front outlet port
Position A
0.172
0.181
Position B
0.161
0.168
Position C
0.172
0.181
Position D
0.152
0.165
Table 3. Comparison of velocities from experiment and simulation for the model room.
3.5 Calculus simulation
Based on the theory that the airflow convection effect is much stronger than the diffusion
effect, this research aims to limit the air energy to a certain area by means of creating a
circulation cell. The inlet airflow speed acts as the inertia, and the outlet vacuum pressure provides the centrifugal force required to form a circulation cell. In this manner, the RACM
can create in the room a certain area that has the temperature different from the rest of the room. In this study, a total of two groups were simulated using FLUENT for a summer
period. The room’s internal dimensions were 10m 5m 3.2m as shown in Fig. 3. The left
corner zone of the right side of symmetrical plane (RSSP) (length = 0.11.2 m; height = 01.4
m) corresponds to the occupied zone of the room as depicted in Fig. 3.
4. Results and discussion
4.1 CFD results
In this study, the RACM system was built based on the tested RACM in room with the length, diameter, and height of outlet port of pipe fixed, distance between inlet and outlet ports as constants. Nevertheless, the distance between floor surface and outlet port (ground effect distance) is adjusted with L2 from 0.1 to 0.9 m. The height of inlet port of pipe are adjusted with h1 from 0.06m to 0.1m.
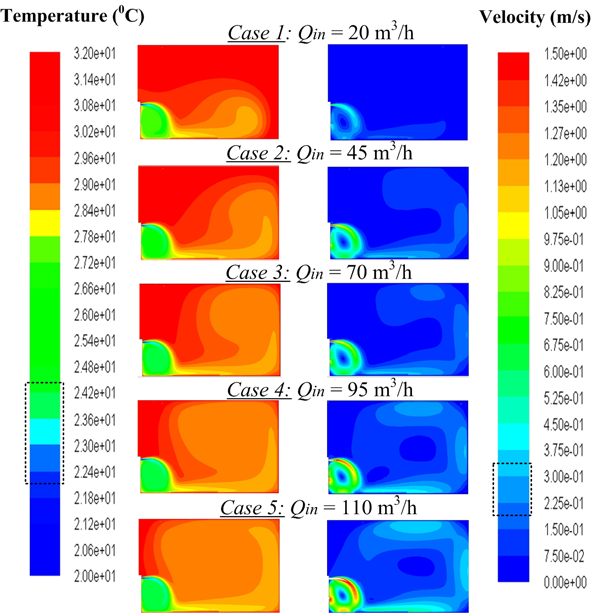
4.1.1 Effect level of Qin on establishing independent airflow cell process The simulated results show the effect of the levels of Qin and L2 on the thermal comfort at
occupied zone and energy saving potential. The RSSP is the important plane, since it
represents the condition of the symmetrical plane well. The level effect of Qin adjustment on establishing independent cell process in the case of L2 = 0.5 m and the inlet velocity being adjusted from Qin = 20 m3/h to 110 m3/h is presented in Fig. 5. Fig. 5 depicts the thermal environment on the RSSP after five hundred seconds of cooling. It is seen from Fig. 5 that
286
Applied Computational Fluid Dynamics
the air supply flow rate acts as the inertia and the outlet vacuum pressure provides the
centrifugal force to form an independent airflow circulation cell well. Energy and
concentration are kept well inside the cell. It is also observed from Fig. 5 that it can form the coolest region at the left corner zone of the RSSP in some of the studied cases. The airflow loss increases as inlet velocity increases, there is airflow changing to horizontal direction and moving further away from occupied zone that is the cause of making whole cooled
room and consume much cooling load. The average air temperature and velocity in these
zones is in the range of 22.124.4 °C and 0.210.34 m/s, respectively. These are the
comfortable temperature and velocity magnitude for the occupant in mainly sedentary,
activity during summer conditions [21].
Fig. 5. Temperature and velocity distribution at the occupied zone of the room RSSP with
different Qinlet ( L2 = 0.5m).
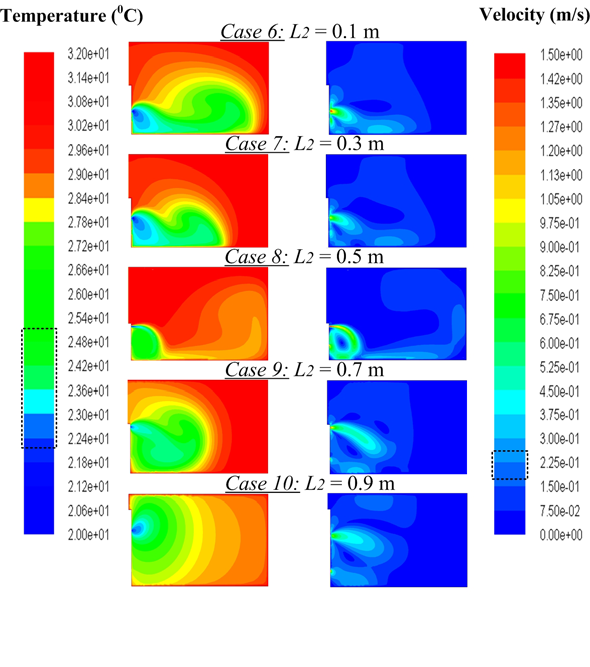
4.1.2 Effect level of L2 on establishing independent airflow cell process
The level of the ground effect adjustment on creating of the independent airflow circulation cell in the case under the Qin = 45 m3/h and the ground effect distance being adjusted from the L2 = 0.1 to 0.9 m is presented in Fig. 6. This figure shows clearly that the independent cell is significantly affected by the L2 adjustment. With L2 = 0.1 and 0.3 m, the independent cell at occupied zone is smaller than that of the case of L2 = 0.5 m. The reason for this is that
Study of an Individual Air-Conditioning Energy-Saving Equipment
287
presumably the cooling airflow entering the room travels shorter distance possible than that of L2 = 0.5 m case before leaving the room. For the case of L2 = 0.5 m the relative distance between room ground and outlet port is long enough to form a good independent cell that
fills almost all of the occupied zone with just a small airflow loss that is located at the
bottom surface. Going through the two cases of L2 = 0.7 and 0.9 m of Fig. 6, one can observe the changes in the flow field where the position of the inlet port is higher than that of the L2
= 0.5 m case along the RACM wall. In these cases, the area occupied by the independent
airflow cell diminishes and the temperature distribution will increase to a larger area of the room as L2 is increased. This is because of the fact that as the distance between floor surface and outlet port increases the ground effect is not strong enough to aid this cooling air inlet flows back to the outlet port. The mean velocity of the occupied zone varies from 0.19 m/s
to about 0.27 m/s. The temperature in the same group varies between 22 C to about 25.1 C
in the occupied zone. This indicates a temperature rise about 3.3 C for the varied relative distance between room ground and outlet port. Therefore, the distribution patterns in Figs. 5
and 6 show that an independent airflow cell can be successfully established. The suitable
adjustment of the L2 for a better creating of the independent airflow cell was achieved in the occupied zone as the L2 is 0.5 m.
Fig. 6. Temperature and velocity distribution at occupied zone of room with different L2
( Qinlet = 45 m3/h).
288
Applied Computational Fluid Dynamics
4.2 Thermal comfort indices
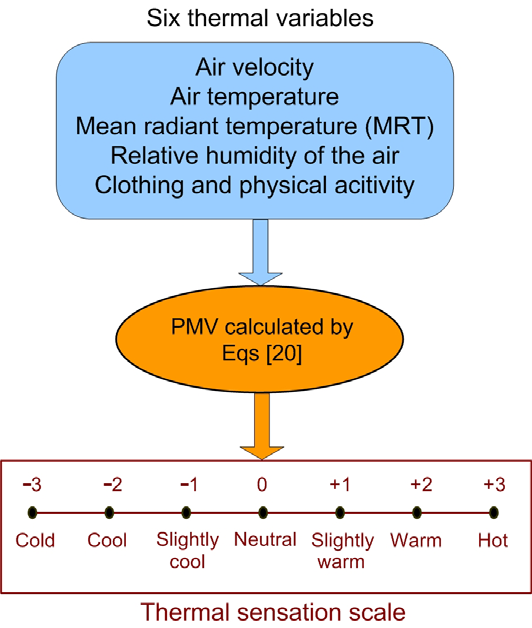
The thermal comfort of an occupied zone is an important issue. One method of assessing
thermal comfort is to use the equations for predicted mean vote (PMV) proposed by Fanger
[21, 22]. PMV is defined by six thermal variables of indoor air and conditions of human
occupants: air velocity, air temperature, mean radiant temperature (MRT), relative humidity
of the air, clothing, and physical activity. Figure 7 shows a combination of each thermal
variable affecting PMV level. Fanger showed that values of PMV between 0
.5 and 0.5
are
in the range within which 90% of people are satisfied [21, 22]. The PMV corresponds to a
prediction of the mean value of the votes of a large group of persons on the seven-point
thermal sensation scale as shown in Fig.7.
Fig. 7. Thermal comfort index.
The thermal comfort PMV index in this study was calculated by using parameters for
cooling conditions in summer, mainly sedentary activity level 1.0 met and with a clothing
thermal resistance of 0.5 clo. Relative humidity is assumed to be 50 % in the room, and
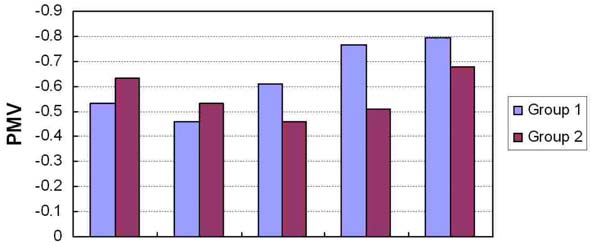
MRT has been estimated using the P1 radiation model [21, 22]. The overall thermal climate predicted by the PMV index can be seen in Fig. 8. It is seen from Fig. 8. that the PMV index is sensitive in air supply flow rate increase and various outlet positions. In group 1, case 5
has the worst PMV index among five cases, because the highest Qin enters the room that
Study of an Individual Air-Conditioning Energy-Saving Equipment
289
causes the occupied zone to become less comfortable. The case 2 with Qin = 45 m3/h seems to offer higher PMV potential among five cases in group 1, it was therefore chosen to be
investigated the effect of L2 in this study. Moving on to the group 2, the PMV index in case 8
gives higher potential with L2 = 0.5 m. When L2 is 0.1 m in case 6, the cooling flow entering the room travels the shortest distance between the floor surface and the outlet port before
leaving the room, therefore the airflow circulation cell is smaller than that of the rest cases, it may cause a lower PMV value in case 6. When L2 is 0.9 m in case ten, the airflow circulation cell diminishes that causes the PMV potential decrease in occupied zone in the room. Case 8
seems to offer higher PMV potential in group 2. Therefore, it may be seen that if the
parameters are set for the RACM system as in case 8, it will be the one among ten simulated
cases in this study which offer the most thermal comfort.
Fig. 8. PMV variation in the occupied zone
4.3 Vertical temperature profiles
The difference in the vertical air temperature between the feet and the head must be
considered in determining conditions for acceptable thermal comfort. The vertical
temperature profile is a function of sedent