qc U
q
Moving now from differential values to finite values, these expressions can be rewritten as: C
C 2
,
2
(8)
l
l
c U C C
m
m
qc U
q
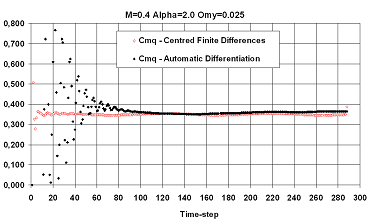
The curve related to finite differences fluctuates because of the fluctuating values of C
l ,
computed by using the primitive solver. Conversely, the AD curve is much more stable;
after an initial transient, the curve becomes almost steady and quickly converges. Table 2
shows both values and percentage errors between the two curves; it is evident that errors do vary mainly because of the finite differences fluctuations, while automatic differentiation
numerical values show a good steadiness.
306
Applied Computational Fluid Dynamics
Time-step
Clq FD
Clq AD
Error %
0 3.43E+00
2.76E+01
-704.96%
20 3.18E+00
2.37E+00
25.52%
40 3.52E+00
2.81E+00
20.18%
60 3.53E+00
3.05E+00
13.61%
80 3.20E+00
3.33E+00
-3.97%
100 3.02E+00
3.25E+00 -7.59%
120 3.25E+00
3.23E+00 0.74%
140 3.56E+00
3.19E+00 10.51%
160 3.48E+00
3.19E+00 8.55%
180 3.13E+00
3.22E+00 -2.68%
200 3.03E+00
3.25E+00 -7.09%
220 3.26E+00
3.25E+00 0.21%
240 3.58E+00
3.24E+00 9.68%
260 3.42E+00
3.26E+00 4.77%
280 3.08E+00
3.27E+00 -6.04%
Table 2. Clq comparison - AD vs FD - values and errors M=0.4, =2.0°, =1°, y=0.025
rad/s
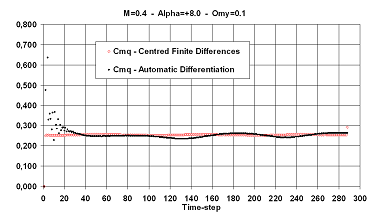
Similar considerations can be repeated for C (Fig. 2). In this case percentage errors are q
m
initially very high but convergence is fast and the error becomes smaller than 5%
Fig. 9. Comparison between automatic differentiation and finite differences Cmq derivatives
M 0.4, 2, 1, 0.025
y
rad s .
Unsteady Differentiation of Aerodynamic Coefficients: Methodology and Application
307
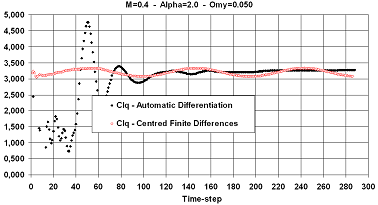
The following figures (Fig. 10 and 11), show the values of derivatives for the same flight
condition, but with an oscillation frequency 0.05 .
Fig. 10. Comparison between automatic differentiation and finite differences Clq derivatives
M 0.4, 2, 1, 0.050
y
rad s .
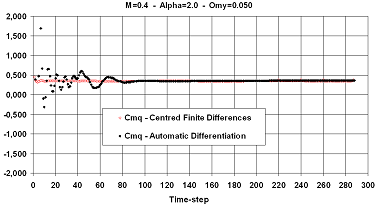
Fig. 11. Comparison between automatic differentiation and finite differences Cmq
derivatives M 0.4, 2, 1, 0.050
y
rad s
The overall progression of results is good, despite some local peaks. As a general behaviour the automatic differentiation provides results much more stable, because of its direct
computation method based on a mathematical management of functions and not on a latter
data handling with FD. Anyway some initial fluctuations have to be expected also in
automatic differentiation, since anyway the relevant derivatives are managed by the
augmented solver as normal functions which need some time to converge.
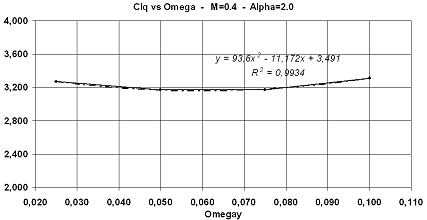
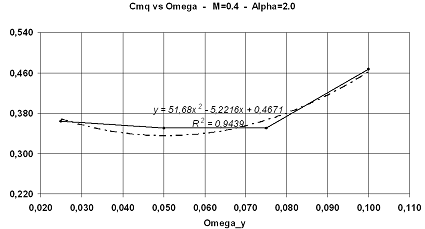
Finally, figures Fig. 12 and 13 show the evolution of C , C ,
lq
dq Cmq as functions of frequencies.
308
Applied Computational Fluid Dynamics
Fig. 12. Automatic differentiation Clq vs frequency progression M 0.4, 2,
1
The relevant interpolating second order curves have been reported, as well as the least
squares values computed as follows:
n
R y
f x
(9)
i
AD
i
i1
The value of yi
f xi
AD value is computed by using the AD, while
is computed by using
the tendency function.
Fig. 13. AD Cmq vs frequency progression M 0.4, 2,
1 .
It is shown that all curves can be reduced to polynomials; however the physical evolution is well modelled by polynomials just in some cases, e.g. for Clq and Cmq, while in other cases
(Cdq) such a reduction cannot be really accepted since curves are not smoothed and a
polynomial reduction is only an algebraic manipulation
Unsteady Differentiation of Aerodynamic Coefficients: Methodology and Application
309
4.1.2 Variable incidence
The same approach described for studying the variable frequency has been applied to
variable angles of attack. The most challenging dynamic behaviour is for 0.1 , so some
curves (Fig. 14-17) and tables are here discussed for such a frequency. The angle of attack
ranges from 5 to 8 .
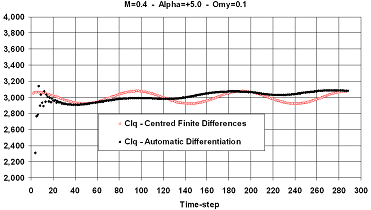
Fig. 14. Comparison between automatic differentiation and finite differences Clq derivatives
M ,4.
0
5 , 1 , 100
.
0
rad s
y
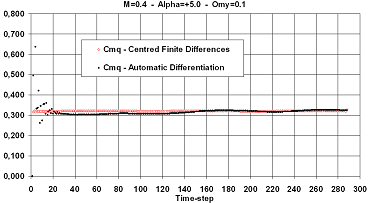
Fig. 15. Comparison between automatic differentiation and finite differences Cmq
derivatives M 0.4, 5, 1, 0.100
y
rad s .
For 5 , the values of percentage errors for C show a strong variability, due to the high q
l
frequency. However, when the solution is stabilised, the percentage error between AD and
310
Applied Computational Fluid Dynamics
FD derivatives is not higher than 4.16 % (time-step 240) and in some points it is close to 0%.
For C , the error reached after stabilisation is 2.03% (time step 260) so showing to be even q
m
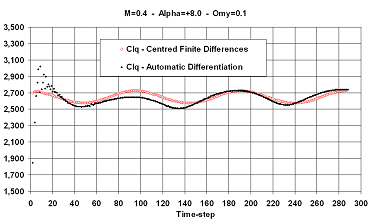
more stable than C . Repeating the same analysis for 8 , both C and C show a q
l
q
l
q
m
similar behaviour and anyway the percentage error between the two methods (AD and FD)
is acceptable.
Fig. 16. Comparison between automatic differentiation and finite differences Clq derivatives
M 0.4, 8, 1, 0.100
y
rad s
Fig. 17. Comparison between automatic differentiation and finite differences Cmq
derivatives M 0.4, 8, 1, 0.100
y
rad s .
Unsteady Differentiation of Aerodynamic Coefficients: Methodology and Application
311
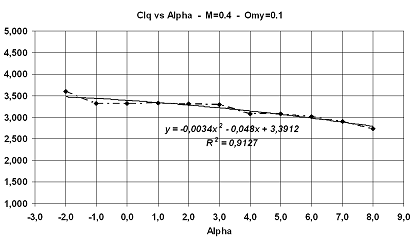
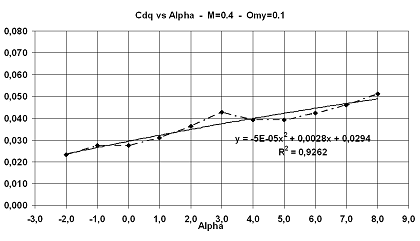
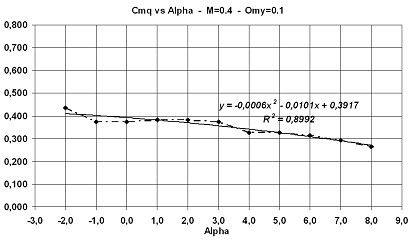
Finally, Fig. 18 to Fig. 20 show the evolutions of C , C ,
lq
dq Cmq as functions of the angle of
attach, ranging in the interval 2;8 . The evolutions are well smoothened and their
regularity is evident.
Fig. 18. Automatic differentiation Clq vs Alpha M 0.4, 1, 0.100
y
rad s
Fig. 19. Automatic differentiation Cdq vs Alpha M 0.4, 1, 0.100
y
rad s .
312
Applied Computational Fluid Dynamics
Fig. 20. Automatic differentiation Cmq vs Alpha M 0.4, 1, 0.100
y
rad s .
4.2 F12
The second sequence of tests has been carried out on the DLR-F12 configuration, working in
inviscid condition at M 0.202 u 70 m s . As already said, F12 has been one of the test benches used in SimSAC; within such a context, DLR and Cerfacs/ONERA generated two
sets of meshes, unstructured and structured respectively, to be used by Partners in order to have a common computing basis. The Euler grid used by Alenia was the unstructured full
configuration, 3802374 nodes, and 25263927 segments. The dimensions of the grid are the
following:
4.951 e 02 x
7.048 e 02
5.
998 e 02 y
5.998 e 02
6.034 e 02 z
5.969 e 02
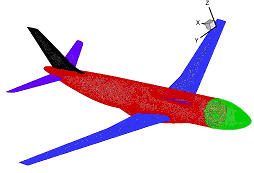
Figure 21 show two views of the overall mesh.
Fig. 21. F12 overall mesh.
Unsteady Differentiation of Aerodynamic Coefficients: Methodology and Application
313
An extensive numerical testing has been carried out by running 15000 iterations to reach the primitive steady solution PS1. After this, the unsteady solution has been computed by
engaging the AD solver and running it for 15000 more iterations.
Computation has been run considering normal environmental conditions; in particular, the
solver has been set to simulate a flight at p 1 Atm, T 25 C
, u 70 m s . Numerical data
have been compared to those acquired during the wind tunnel testing; the German-Dutch
Wind Tunnels premise DNW-NWB, sited in Braunschweig, has been used for the
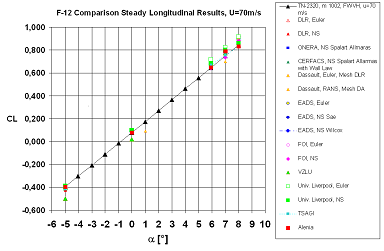
acquisition of experimental data. Static testing included α- and β-sweeps. Figures 22 to 24
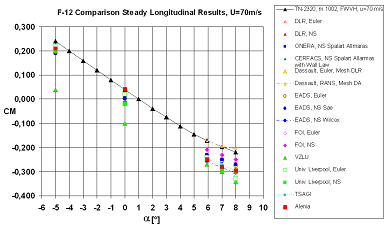
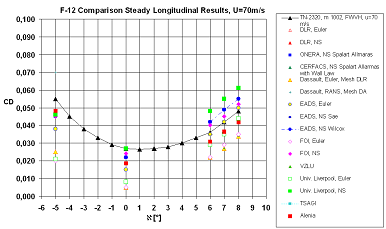
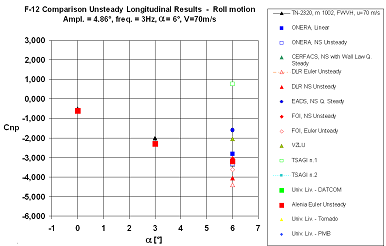
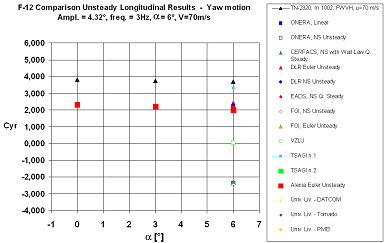
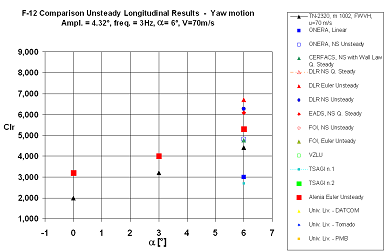
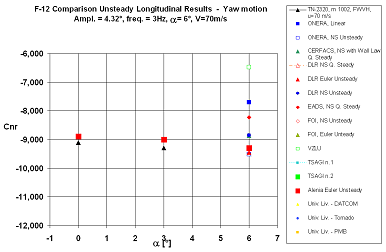
show the evolutions of computed lift, pitch moment and drag coefficients as functions of the angle of attack, compared to the experimental values. It is evident a large data spread, from different Partners, for angles of attack up to 8°, especially for pitch moment and drag. This is mainly due to the different numerical approaches used by different Partners. Fig. 25 to Fig. 27
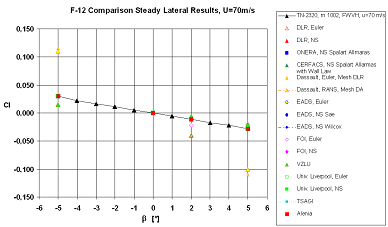
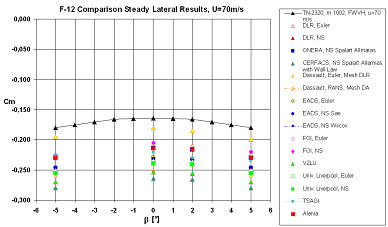
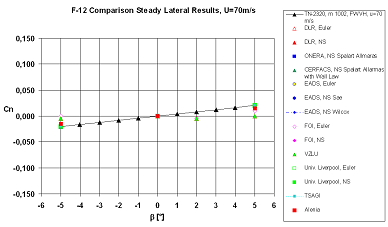
show roll, pitch and yaw moments as functions of sideslip angle; in these cases, the data
spread is evident just for pitch, while for roll and yaw moments data are much more similar
with each other despite different numerical approaches. Figure 28 shows the sensitivity to
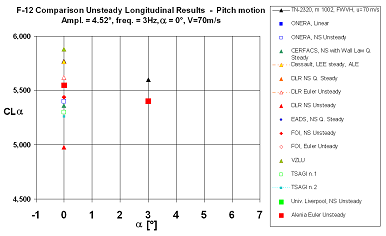
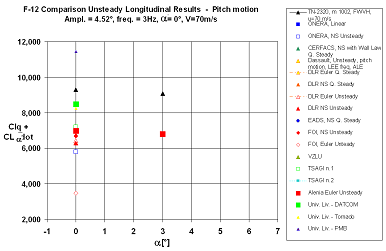
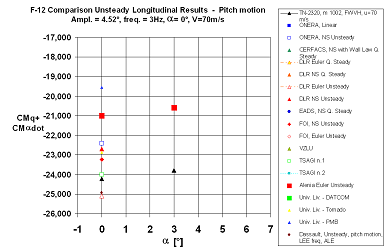
the angle of attack; it is evident that, for an angle of attack 0°, the numerical result exactly overlaps the experimental one. This is the last result, computed in static condition, showed here. Figures 29 and 30 report dynamic sensitivities with respect to the pitch rate in the
longitudinal plane, respectively for lift and pitch moment. Even in this case different
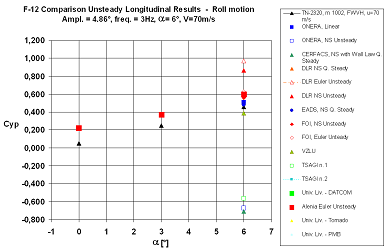
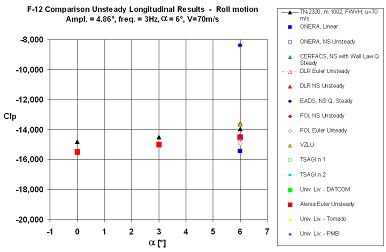
numerical approaches lead to a wide range of results for the same configuration. Dynamic
derivatives with respect to roll and yaw rates are shown in figures 31 to 36. Numerical data are in the latest cases much closer to experimental values and their spread is reduced to a
minimum.
Fig. 22. CL Comparison – Numerical vs. Experimental Results.
314
Applied Computational Fluid Dynamics
Fig. 23. CM Comparison – Numerical vs. Experimental Results.
Fig. 24. CD Comparison – Numerical vs. Experimental Results.
Fig. 25. Cl Comparison – Numerical vs. Experimental Results.
Unsteady Differentiation of Aerodynamic Coefficients: Methodology and Application
315
Fig. 26. Cm Comparison – Numerical vs. Experimental Results.
Fig. 27. Cn Comparison – Numerical vs. Experimental Results.
Fig. 28. CL Comparison – Numerical vs. Experimental Results.
316
Applied Computational Fluid Dynamics
Fig. 29. CLq+CLdot Comparison – Numerical vs. Experimental Results.
Fig. 30. CMq+CMdot Comparison – Numerical vs. Experimental Results.
Fig. 31. Cyp Comparison – Numerical vs. Experimental Results.
Unsteady Differentiation of Aerodynamic Coefficients: Methodology and Application
317
Fig. 32. Clp Comparison – Numerical vs. Experimental Results.
Fig. 33. Cnp Comparison – Numerical vs. Experimental Results.
Fig. 34. Cyr Comparison – Numerical vs. Experimental Results.
318
Applied Computational Fluid Dynamics
Fig. 35. Clr Comparison – Numerical vs. Experimental Results.
Fig. 36. Cnr Comparison – Numerical vs. Experimental Results.
5. Machine in use
All the runs have been carried out on a Quadrics multi-processor platform. The CPU is the
AuthenticAMD working at 2594MHz. The system is made up of 7 computational nodes +1
node dedicated to the file system access. Each node has 4 processors. The physical memory
of each node is 3943 MB and the virtual one is 8189 MB.
6. Conclusion
Automatic differentiation in static and dynamic condition has shown to be reliable for
industrial application. Even if a comparison with the FD technique may be enough to
qualify the AD approach, the final and definitive confirmation comes from the comparison
with experimental data. According to what has been achieved, one can say that:
Unsteady Differentiation of Aerodynamic Coefficients: Methodology and Application
319
AD is reliable;
Alenia Aeronautica approach is reliable;
AD provides a good alternative to the methods used by other Companies or Research
Centres.
Following another work of the Authors (Ref. [12]) it is confirmed that a software
reengineering activity is necessary after having generated the augmented code. This implies
a cost in terms of time and deployed effort, for optimizing the augmented code lines,
memory allocations and splitting the code in several components. Time saving achieved
with AD is indeed remarkable if compared to other classical means to evaluate derivatives,
and it provides an evaluation of the exact derivatives avoiding problems related to mesh
refinement. Static and dynamic differencing procedures are clear enough to allow a daily
use of AD features in the daily industrial activities. An extensive testing is now ongoing at Alenia premises in Turin in order to investigate:
a faster procedure to obtain dynamic derivatives, avoiding three different computing
phases;
the application of AD for computing derivatives of higher order;
the extension of AD to turbulence.
Further experiments related to the shape optimization, mesh adaptation and consequent
resizing are currently in progress and are very promising.
7. Acknowledgments
The present work has been performed through a close cooperation between Politecnico di
Torino, SimSAC project under funding from the Sixth Framework program of the European
Union and Alenia Aeronautica S.p.A and through the use of Confidential Information and
Data, property of Alenia Aeronautica S.p.A. which remains the sole owner of all such
relevant IP rights.
The results of the present work shall be, therefore, property of Alenia Aeronautica S.p.A.
8. References
Almosnino, D. Aerodynamic Calculations of the Standard Dynamic Model in Pitch and Roll
Oscillations, 32nd Aerospace Sciences Meeting & Exhibit, AIAA Paper 94-0287,
January 1994.
Altun, M. & Iyigun, I. Dynamic Stability Derivatives of a Manoeuvring Combat Aircraft
Model, Journal of Aeronautics and Space Technology, January 2004, Vol. I, No. 3,
pp. 19-27.
Anderson, W. K., Newmann, J. C., Whitfield, D. L. & Nielsen, E. J. Sensitivity Analysis for the Navier-Stokes Equations on Unstructured Meshes Using Complex Variables,
AIAA Paper 99-3294, June 1999.
Anderson, D. A., Tannehill, J. C. & Pletcher R. H., Computational Fluid Mechanics and Heat Transfer, 1st edition, McGraw-Hill, New York, 1984, pp. 39-46.
Guglieri, G. & Quagliotti, F. B. Dynamic Stability Derivatives Evaluation in a Low Speed Wind Tunnel, Journal of Aircraft, Vol. 30, No. 3, pp. 421-423, 1993.
Guglieri, G., Quagliotti & F. B., Scarabelli, P. L. Static and Oscillatory Experiments on the SDM at Politecnico di Torino, Nota Scientifica e Tecnica n. 74/93, 1993, Forced
320
Applied Computational Fluid Dynamics
Oscillation Technique-Reference Documentation, Vol. 3, Politecnico di Torino,
DIASP.
Murphy, P. C. & Klein, V. Estimation of Aircraft Unsteady Aerodynamic Parameters from
Dynamic Wind Tunnel Testing, AIAA Paper 2001-4016, 2001.
Newmann, J. C., Anderson, W. K. & Whitfield, D. L. Multidisciplinary Sensitivity
Derivatives Using Complex Variables, MSSU-COE-ERC-98-09, Engineering
Research Centre Report, Mississippi State University, July 1998.
Green, L., Spence, A. & Murphy, P. Computational Methods for Dynamics Stability and
Control Derivatives, AIAA Paper 2004-0015, January 2004.
Hascoet, L. Analyses Statiques et Transformation de Programmes: de la parallélisation à la
différentiation, Inria Database [online database], 2005, pp. 163-169, http://www-
sop.inria.fr/members/Laurent.Hascoet/papers/ hdrHascoet5.html
Hascoet, L. & Pascual, L. Tapenade 2.1 User Guide, Hal-Inria Database [online database], September 2004, pp. 8-13, http://hal.inria.fr/docs/00/06/98/80/PDF/RT-0300.pdf [retrieved 19 May 2006].
Necci, C., Ceresola, N., Guglieri & G., Quagliotti, F. Industrial Computational Fluid
Dynamics Tools for the Evaluation of Aerodynamic Coefficients, Journal of Aircraft
Vol. 46, November-December 2009, pp. 1973-1983.
Selmin, V. Application of Automatic Differentiation to Aerodynamic Shape Optimization,
ECCOMAS 2004, [online database],
http://www.imamod.ru/~serge/arc/conf/ECCOMAS-2004/ECCOMAS_V2/
proceedings/pdf/611.pdf, [retrieved 28 July 2004]
15
Use of Fluid Dynamic Simulation to
Improve the Design of Spouted Beds
Rodrigo Béttega1, Ronaldo Guimarães Corrêa2 and José Teixeira Freire2
1Federal University of Uberlândia, School of Chemical Engineering
2Federal University of São Carlos, Department of Chemical Engineering
Brazil
1. Introduction
The use of spouted beds in numerous chemical and pharmaceutical industrial processes and
in the agricultural industry has become popular principally because they enable high rates
of heat and mass transfer to take place between system phases. However, despite the
advances achieved through research into spouted beds over the more than 50 years since
their invention, it continues to be difficult to obtain detailed information regarding the