Figure 10: Monthly variations of inorganic nitrite (µM) concentration in seawater recorded
at stations I, II and III from July 2010 to June 2012.
Figure 11: Monthly variations of total nitrogen (µM) concentration in seawater recorded at
stations I, II and III from July 2010 to June 2012.
ISBN: 978-967-14475-3-6; eISBN: 978-967-14475-2-9 460
Biotech Sustainability (2017)
Ecology, Distribution and Diversity of Bioluminescent Bacteria Srinivasan et al.
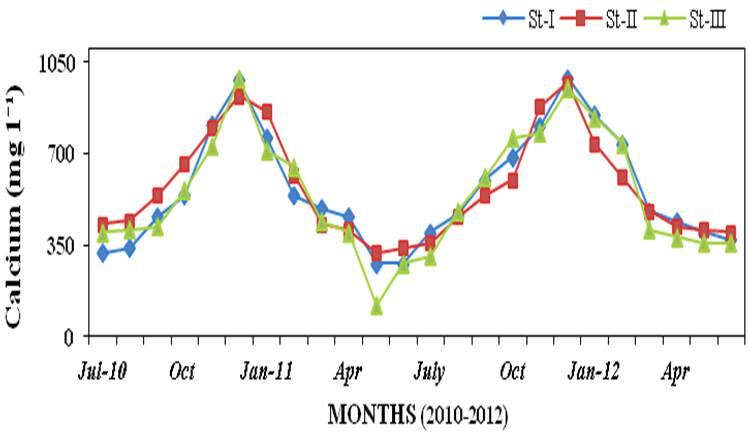
calcium (120 to 990 mg l-1; Figure 12)
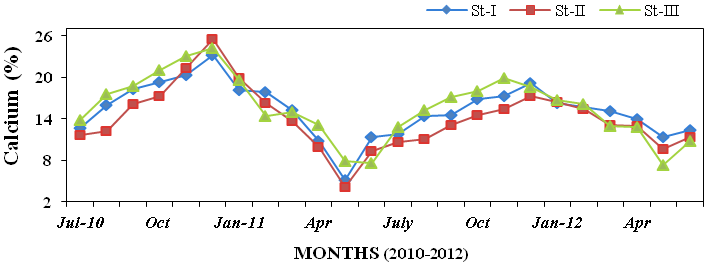
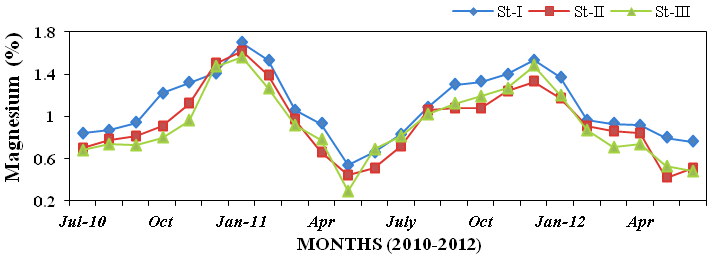
25.44%; Figure 20), magnesium (0.29 to
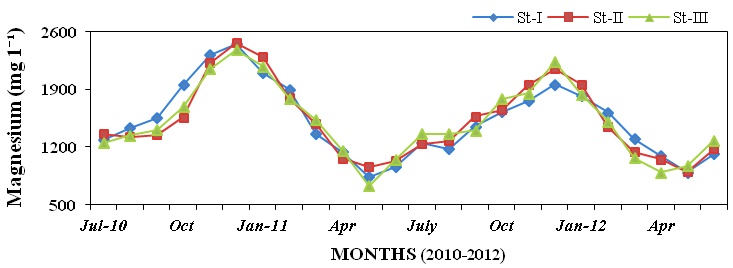
and magnesium (730 to 2460mg l-1; Fig-
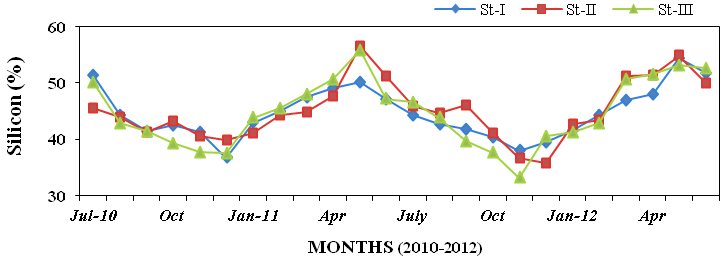
1.7%; Figure21), silicon (33.2 to 56.53%;
ure13). The bacterial diversity revealed
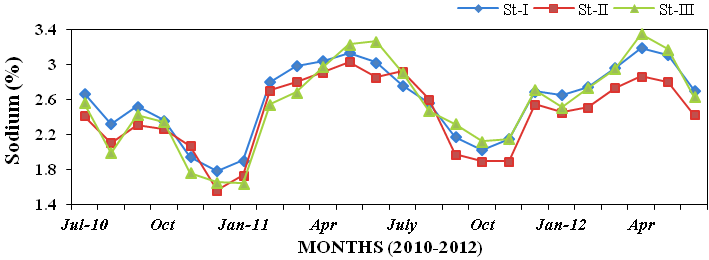
Figure 22), sodium (1.56 to 3.35%; Fig-
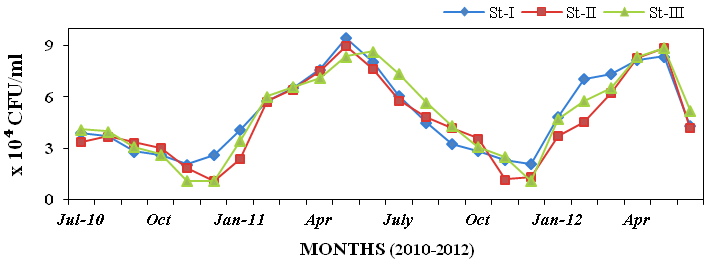
that, the bioluminescent bacterial popula-
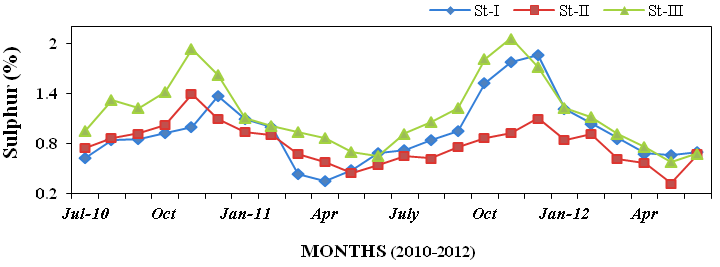
ure 23), sulphur (0.32 to 2.06%; Figure
tion density was varied from 1.06 x 10⁴ to
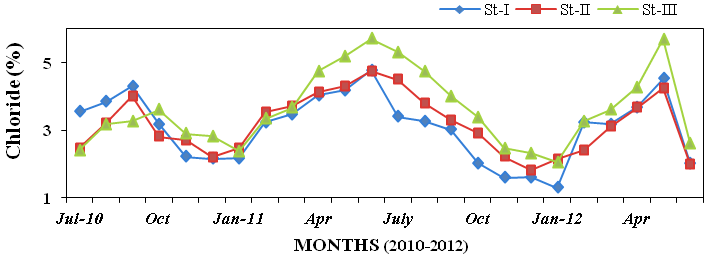
24), chloride (1.3 to 5.71%; Figure 25),
9.44 x 10⁴ CFU/ml in seawater (Figure
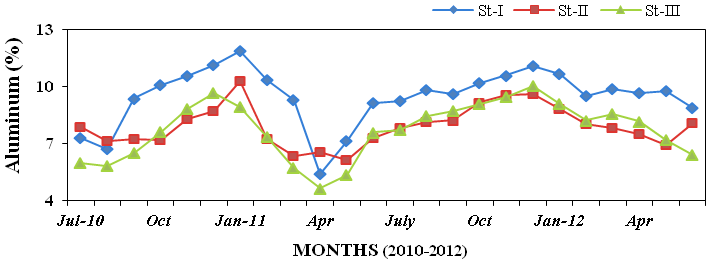
aluminium (4.63% to 11.87%; Figure 26),
14).
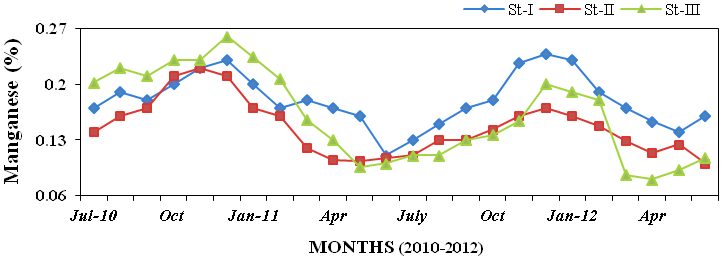
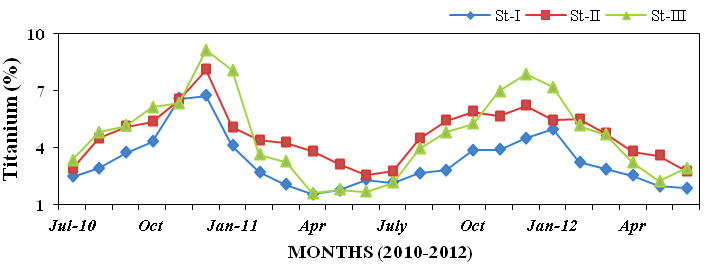
titanium (1.55 to 9.15%; Figure 27), man-
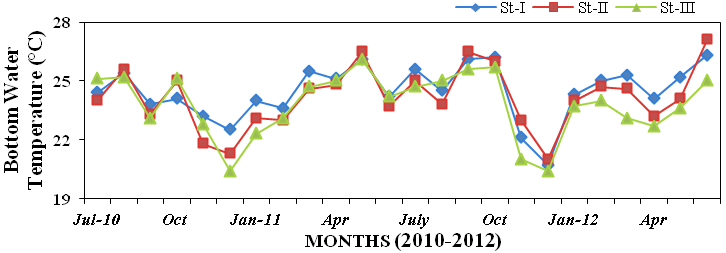
Bottom water temperature was in
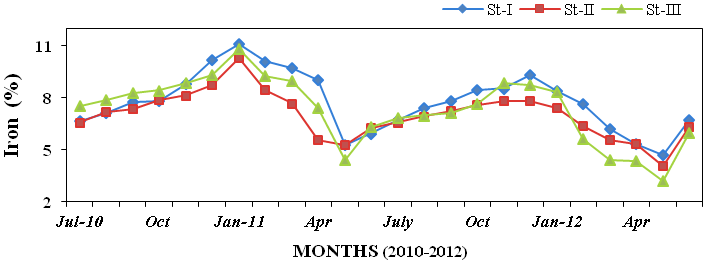
ganese (0.08 to 0.26%; Figure28), iron
the range of 20.4 to 27.1ºC during the
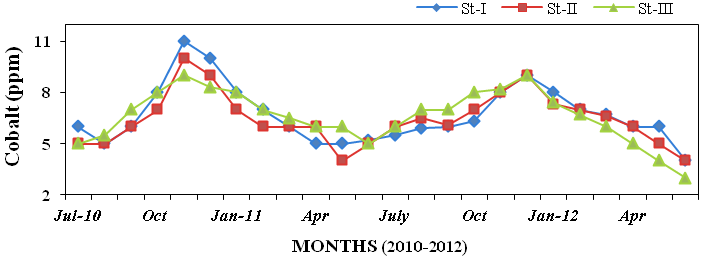
(3.2 to 11.13%; Figure 29), cobalt (3 to
study period at all three stations (Figure
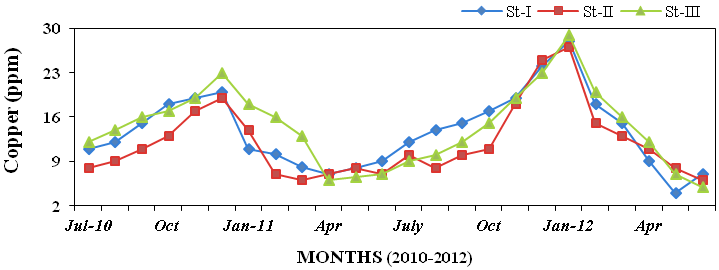
11ppm; Figure 30), copper (4 to 29ppm
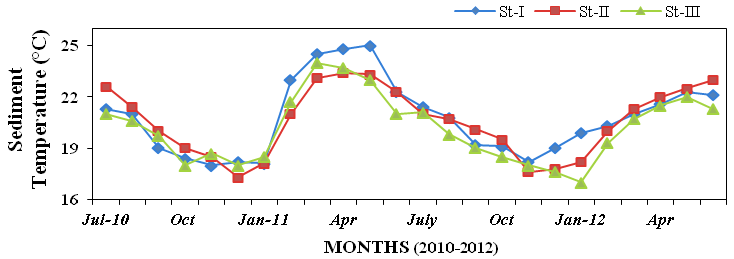
15). Sediment temperature varied from 17
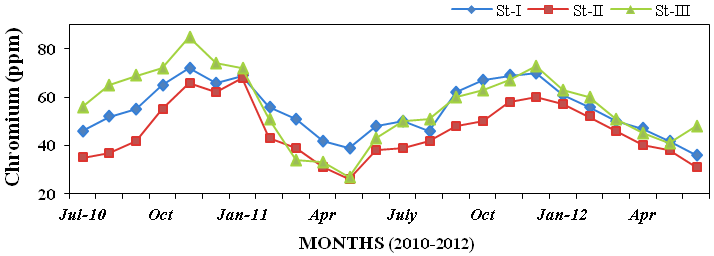
Figure 31), chromium (26 to 85ppm; Fig-
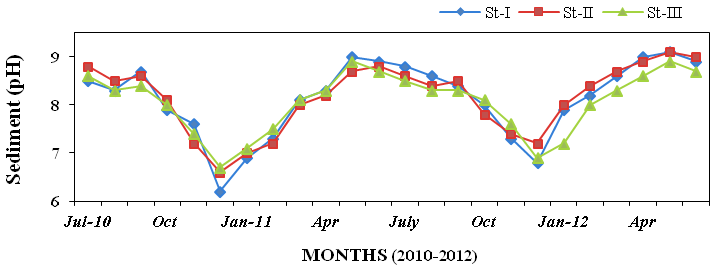
to 25ºC (Figure 16). Sediment pH varied
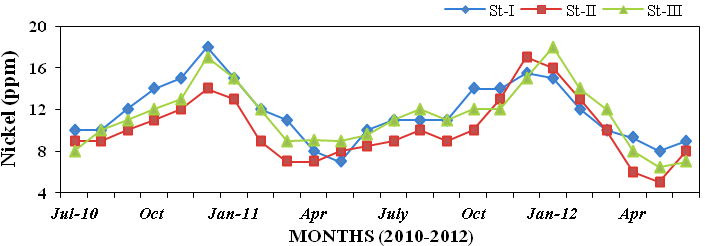
ure 32), nickel (5 to 18ppm; Figure 33)
from 6.2 and 9.1 at all stations (Figure
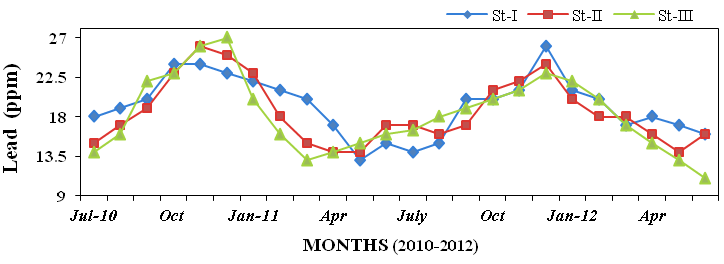
and lead (11 to 27ppm; Figure 34). In sed-
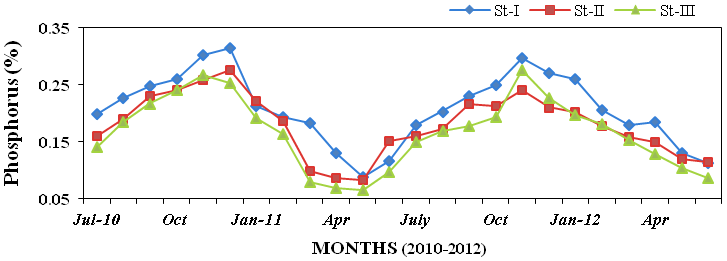
17). The results for sediment nutrients
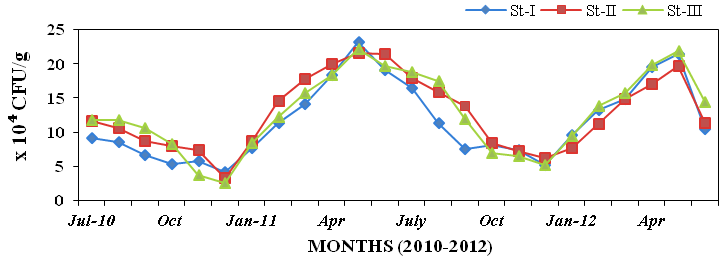
iment, the bioluminescent bacterial popu-
showed that phosphorus (0.065 to
lation density varied from 2.6 x10⁴ to 23.2
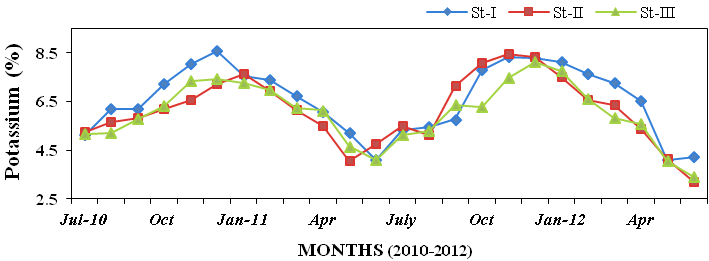
0.315%; Figure 18), potassium (3.18 to
x104 CFU/g (Figure 35).
8.57%; Figure 19), calcium (4.08 to
Figure 12: Monthly variations of calcium (mg l-1) concentration in seawater recorded at
stations I, II and III from July 2010 to June 2012.
Figure 13: Monthly variations of magnesium (mg l-1) concentration in seawater recorded at
stations I, II and III from July 2010 to June 2012.
Figure 14: Monthly variations of bioluminescent bacteria (CFU/ml x 104) populations in
seawater recorded at stations I, II and III from July 2010 to June 2012.
ISBN: 978-967-14475-3-6; eISBN: 978-967-14475-2-9 461
Biotech Sustainability (2017)
Ecology, Distribution and Diversity of Bioluminescent Bacteria Srinivasan et al.
Figure 15: Monthly variations in bottom water temperature (ºC) recorded at stations I, II
and III from July 2010 to June 2012.
Figure 16: Monthly variations in sediment temperature (ºC) recorded at stations I, II and III
from July 2010 to June 2012.
Figure 17: Monthly variations of hydrogen ion concentration (pH) in sediment recorded at
stations I, II and III from July 2010 to June 2012.
Figure 18: Monthly percentage variations of phosphorus (%) concentration in sediment
recorded at stations I, II and III from July 2010 to June 2012.
ISBN: 978-967-14475-3-6; eISBN: 978-967-14475-2-9 462
Biotech Sustainability (2017)
Ecology, Distribution and Diversity of Bioluminescent Bacteria Srinivasan et al.
Figure 19: Monthly percentage variations of potassium (%) concentration in sediment rec-
orded at stations I, II and III from July 2010 to June 2012.
Figure 20: Monthly percentage variations of calcium (%) concentration in sediment rec-
orded at stations I, II and III from July 2010 to June 2012.
Figure 21: Monthly percentage variations of magnesium (%) concentration in sediment
recorded at stations I, II and III from July 2010 to June 2012.
Figure 22: Monthly percentage variations of silicon (%) concentration in sediment record-
ed at stations I, II and III from July 2010 to June 2012.
ISBN: 978-967-14475-3-6; eISBN: 978-967-14475-2-9 463
Biotech Sustainability (2017)
Ecology, Distribution and Diversity of Bioluminescent Bacteria Srinivasan et al.
Figure 23: Monthly percentage variations of sodium (%) concentration in sediment record-
ed at stations I, II and III from July 2010 to June 2012.
Figure 24: Monthly percentage variations of sulphur (%) concentration in sediment record-
ed at stations I, II and III from July 2010 to June 2012.
Figure 25: Monthly percentage variations of chloride (%) concentration in sediment rec-
orded at stations I, II and III from July 2010 to June 2012.
Figure 26: Monthly percentage variations of aluminum (%) concentration in sediment rec-
orded at stations I, II and III from July 2010 to June 2012.
Figure 27: Monthly percentage variations of titanium (%) concentration in sediment rec-
orded at stations I, II and III from July 2010 to June 2012.
ISBN: 978-967-14475-3-6; eISBN: 978-967-14475-2-9 464
Biotech Sustainability (2017)
Ecology, Distribution and Diversity of Bioluminescent Bacteria Srinivasan et al.
Figure 28: Monthly percentage variations of manganese (%) concentration in sediment
recorded at stations I, II and III from July 2010 to June 2012.
Figure 29: Monthly percentage variations of iron (%) concentration in sediment recorded at
stations I, II and III from July 2010 to June 2012.
Figure 30: Monthly variations of cobalt (ppm) concentration in sediment recorded at sta-
tions I, II and III from July 2010 to June 2012.
Figure 31: Monthly variations of copper (ppm) concentration in sediment recorded at sta-
tions I, II and III from July 2010 to June 2012.
ISBN: 978-967-14475-3-6; eISBN: 978-967-14475-2-9 465
Biotech Sustainability (2017)
Ecology, Distribution and Diversity of Bioluminescent Bacteria Srinivasan et al.
Figure 32: Monthly variations of chromium (ppm) concentration in sediment recorded at
stations I, II and III from July 2010 to June 2012.
Figure 33: Monthly variations of nickel (ppm) concentration in sediment recorded at sta-
tions I, II and III from July 2010 to June 2012.
Figure 34: Monthly variations of lead (ppm) concentration in sediment recorded at stations
I, II and III from July 2010 to June 2012.
Figure 35: Monthly variations of bioluminescent bacteria (CFU/g x 104) populations in
sediment recorded at stations I, II and III from July 2010 to June 2012.
4. Discussion
tool for the assessment and monitoring of
coastal ecosystems. The similar results
Based on the results, the physico-
and trend was observed in Muthupattai
chemical parameters, heavy metals in wa-
mangroves, Southeast coast of India
ter and sediments would form a useful
(Ashokkumar et al., 2009; Senthilnathan
ISBN: 978-967-14475-3-6; eISBN: 978-967-14475-2-9 466
Ecology, Distribution and Diversity of Bioluminescent Bacteria Srinivasan et al.
and Balasubramanian, 1999). The higher
luminescent bacteria showed a positive
concentration of metals were recorded
correlation with salinity at station-I (r=
during monsoon season, which could be
0.773; P< 0.001), station-II (r= 0.903; P<
mainly due to land runoff and influx of
0.001) and station-III (r=0.837; P< 0.001)
metal rich freshwater that in turn reflects
and water pH at station-I (r=0.726; P<
in the metal concentration in sediment
0.01), station-II (r= 0.631; P< 0.01) and
(Athalye and Gokhale, 1989). The as-
station-III (r=0.874; P< 0.001) The counts
sessment of trace metal concentrations
were at low levels during the active mon-
and distribution in marine water and sed-
soon period because of high rainfall. The
iment leads to an understanding of their
monsoonal flood water may have altered
behaviour and detects the pollution source
the luminous bacterial population from
in marine environment (Forstner and
sediment as the Vellar estuary is shallow
Wittman, 1979). Besides substantiating
(Ramesh et al., 1989). Further, the maxi-
higher biological productivity, higher
mum atmospheric, surface water and sed-
densities of luminous bacteria in this bay
iment temperature were recorded during
also signify pollution free environment in
summer at station I and minimum was
this region.
recorded during monsoon at station III.
Bioluminescent bacteria are being
Maximum bottom water temperature was
found in marine environment. Microbial
recorded during pre-monsoon at station I
activities play an important role in marine
and minimum was recorded during mon-
food webs, nutrient mineralization and
soon at station III. Surface water tempera-
recycling. The ecological importance of
ture was slightly higher than the bottom
bioluminescence in the ocean is evident in
water at all the stations. Surface and bot-
the dominance of light emitters in open
tom water temperature of all stations are
waters. Ecology of bioluminescent bacte-
slightly varied monthly. Temperature is
ria has focused primarily on distribution
an important environmental factor, can
of these organisms in marine environment
influence the diversity of luminous bacte-
(Nealson and Hastings, 1979); Atalntic
ria (Ruby and Nealson, 1978; Yetinson
Ocean (Ramaiah and Chandramohan,
and Shilo, 1979; Ruby et al., 1980). Dun-
1988), Indian Ocean (Lynch, 1981) and
lap (2009) reported that the temperature
near shore water Porto Nova (Ramesh et
relationships of luminous bacteria appear
al., 1989).
to be a specific to Vibrio species . Accord-
The present study was carried out
ing to Govindasamy et al. (2000), the sur-
to understand the role of ecological pa-
face water temperature could be changed
rameters of the bioluminescent bacteria
by the intensity of solar radiation; evapo-
(during July 2010 - June 2012) at differ-
ration, freshwater influx, cooling and it
ent stations of Palk Strait region, India.
might mix up with ebb and flow form ad-
The maximum counts of bioluminescent
joining neritic water. It is further evident
bacteria in seawater/ sediments samples
that the atmospheric temperature showed
was recorded during summer season (May
positive correlation at station-II (r= 0.663;
2011) at station I; whereas, minimum
P< 0.01) and at station - III (r= 0.685; P<
counts of bioluminescent bacteria sea-
0.01) to seawater with CFU microbial
water/ sediment samples was recorded at
counting at all the stations. Surface water
monsoon season (2010) at station III. The
temperature was found low during mon-
CFU values suggested that the higher
soon because of rainfall but the maximum
population counts were recorded during
temperature was observed during summer
the summer months during the study peri-
(Kannapiran et al., 2008). This could be
ods at all the stations. This variation
attributed due to high solar radiation as
might be due to the high-saline relativity.
reported by Ashok Prabu et al. (2008).
The statistical analysis revealed that sea-
Lower temperature was observed due to
water colony forming unit (CFU) of bio-
cloudy sky and rainfall that brought down
ISBN: 978-967-14475-3-6; eISBN: 978-967-14475-2-9 467
Ecology, Distribution and Diversity of Bioluminescent Bacteria Srinivasan et al.
temperature to minimum (Kannan and
fall and the resultant freshwater mixing.
Kannan, 1996). In addition, the surface
The minimum dissolved oxygen was
water temperature showed positive corre-
found during summer months, which
lation with colony forming unit (CFU) at
could be mainly due to reduced agitation
station - II (r= 0.635; P< 0.02) and at sta-
in the coastal and estuarine water (Ruby
tion - III (r= 0.627; P< 0.02). Further, the
and Nealson, 1978; Nealson and Hasting,
statistical analysis revealed that the sedi-
1979). Further, this is evidenced by the
ment colony forming unit of biolumines-
negative correlation between the dis-
cent bacteria showed a positive correla-
solved oxygen and seawater CFU at sta-
tion with sediments temperature at station
tion-III (r= -0.823; P< 0.001).
- I (r= 0.806; P< 0.001), station-II (r=
Maximum particular organic car-
0.842; P< 0.001) and station-III (r= 0.784;
bon (POC) was recorded during the
P< 0.001).
month of November (2010) at station-II
Surface water salinity was reduced
and minimum POC was observed during
greatly during the monsoon and it was
the month of May (2012) at station-I. The
gradually increased from postmonsoon to
maximum POC content in water was
summer at all stations. The maximum sa-
mainly due to the organic matter brought
linity could be due to low amount of rain-
in from the land through run-off. Further,
fall and higher rate of evaporation in the
it could be also due to the presence of
shallow coastal area owing to high at-
plant (seagrass and seaweeds) and animal
mospheric temperature (Govindasamy
organic matter within the seagrass ecosys-
and Kannan, 1991). Significantly positive
tem and exported from the adjacent eco-
correlation was observed between sea-
system by wind and wave action. Further,
water salinity and CFU of bioluminescent
the seasonal variation in POC content in
bacteria at station-I (r= 0.773; P< 0.001),
the water could be related to the plankton
station-II (r= 0.903; P< 0.001) and sta-
productivity (Kannapiran et al., 2008).
tion-III (r= 0.837; P< 0.001). The present
This is further evidenced by the negative
study results are in line with the research
correlation between POC and seawater
findings of Abraham et al. (2003).
CFU at station-I (r= -0.786; P< 0.001),
The high pH values recorded dur-
station-II (r= -0.841; P< 0.001) and sta-
ing summer and this might be due to the
tion-III (r= -0.832; P< 0.001).
influence of seawater penetration and
Maximum inorganic phosphate
high biological activity. These findings
was observed during the monsoon season
are in accordance with the previous report
(December 2010) at station-III and mini-
(Smith and Key, 1975). The statistical
mum was recorded during the summer
analysis shows the positive correlation
season (May 2011) at station-I. Possibly,
between pH and CFU station - I (r=0.726;
the maximum concentration of phosphate
P< 0.01) and station - III (r= 0.874; P<
was due to invasion of upwelling of wa-
0.001) to seawater colony forming unit.
ter, which increased the level of phos-
The statistical analysis shows the positive
phate. Low values of phosphate observed
correlation with sediments pH station-I
to utilization by phytoplankton, seagrass-
(r= 0.692; P< 0.001), station-II (r= 0.641;
es and other primary producers (Rajaseg-
P< 0.001) and station-III (r= 0.813; P<
ar, 2003). The statistical analysis shows
0.001) to sediment colony forming unit.
the negative correlation to seawater colo-
Dissolved oxygen is one of the most im-
ny forming unit with inorganic phosphate
portant abiotic parameters influencing the
at station - I (r= - 0.734; P< 0.01), station-
life in the coastal environment. In the pre-
II (r= -0.832; P< 0.001) and station-III (r=
sent study, the maximum dissolved oxy-
-0.828; P< 0.001).
gen was recorded during monsoon and
Minimum concentration of silicate
this might be due to the cumulative effect
was observed during the summer season
of higher wind velocity coupled with rain-
(May 2012) at station II and maximum
ISBN: 978-967-14475-3-6; eISBN: 978-967-14475-2-9 468
Ecology, Distribution and Diversity of Bioluminescent Bacteria Srinivasan et al.
during the monsoon season (November
was recorded during the summer (May
2010) at station III. It might be due to the
2011) at station I. It might be due to
heavy rain, land runoff water mixing was
freshwater inflow was high in the mon-
high level. It has been reported that the
soon season so high level of nitrogen was
silicate from the bottom sediment might
recorded. The statistical analysis showed
have been exchanged with overlaying wa-
total nitrogen a negative correl